
RETHINK DATA: PUT MORE OF YOUR BUSINESS DATA TO WORK—FROM EDGE TO CLOUD | 1 |
RETHINK
DATA
Put More of Your Business Data to Work—
From Edge to Cloud
WITH RESEARCH AND ANALYSIS BY IDC
A SEAGATE TECHNOLOGY REPORT

RETHINK DATA: PUT MORE OF YOUR BUSINESS DATA TO WORK—FROM EDGE TO CLOUD | 2 |
About the Report ............................................................................ 03
Summary of Findings ...................................................................... 04
Survey Highlights ........................................................................... 05
Section I: Global Findings
Chapter 1: The Growth and Sprawl of Data ..................................... 07
Chapter 2: A Treasure Trove of Value ............................................... 13
Chapter 3: The Multicloud ............................................................... 19
Chapter 4: Data Management Challenges and
the Multicloud Ecosystem .............................................. 24
Chapter 5: DataOps: The Missing Link of Data Management ........... 29
Chapter 6: Better Business Outcomes ............................................ 33
Chapter 7: Data Security and Data Management ............................. 36
Section II: Regional Findings
Chapter 1: Asia Pacic and Japan ..................................................... 40
Chapter 2: China ............................................................................... 44
Chapter 3: Europe ............................................................................ 48
Chapter 4: North America ................................................................. 52
Table of Contents

RETHINK DATA: PUT MORE OF YOUR BUSINESS DATA TO WORK—FROM EDGE TO CLOUD | 3 |
About the Report
This Seagate Technology report
draws on a global survey sponsored
by Seagate and conducted by the
independent research rm IDC, which
took place in December 2019 and
January 2020. Seagate authored the
following report to share its forecasts
and opinions, based on the survey
ndings, along with analysis from
IDC. Any content, data, analysis, or
views not attributed to IDC or IDC
analysts are those of Seagate. The
quantitative web survey queried 1500
respondents globally (375 in North
America, 475 in Europe, 500 in APJ,
and 150 in China) from mid-sized
businesses to larger enterprises
in Canada, United States, United
Kingdom, France, Germany, Russia,
Australia, Japan, India, South Korea,
Taiwan, and China. The survey
participants’ professional titles
include CIO, CTO, IT VP, director,
executive, COO/LOB, storage
architect, and solution architect.
Seagate Technology has been a global leader offering data storage and
management solutions for over 40 years. Seagate crafts the datasphere,
maximizing human potential by innovating world-class, precision-
engineered data storage and management solutions with a focus on
sustainable partnerships.

RETHINK DATA: PUT MORE OF YOUR BUSINESS DATA TO WORK—FROM EDGE TO CLOUD | 4 |
Summary of Findings
Today’s unprecedented growth
and sprawl of data result in a
complex movement of data within
an increasingly varied ecosystem
that includes multicloud and the
edge. The complexity of data’s
location compounds business
owners’ data management
challenges. Most data available
to businesses goes untapped.
The survey zeroed in on a solution
to today’s data management
dilemmas: DataOps—a discipline of
connecting data creators with data
consumers. Business leaders who
implement DataOps can count on
better business outcomes.

RETHINK DATA: PUT MORE OF YOUR BUSINESS DATA TO WORK—FROM EDGE TO CLOUD | 5 |
Survey Highlights
• Over the next two years, enterprise
data is projected to increase at a
42.2% annual growth rate.
• Only 32% of data available to
enterprises is put to work. The
remaining 68% goes unleveraged.
• On average, organizations now
periodically transfer about 36%
of data from edge to core. Within
only two years, this number will
grow to 57%. The volume of data
immediately transferred from
edge to core will double, from 8%
to 16%. This means enterprises
will have to manage a lot more
data in motion.
• Managing data in the multicloud
ecosystem is a top data
management challenge expected
over the next two years—with
managing data in hybrid cloud a
close second.
• The top ve barriers to putting data
to work are: 1) making collected data
usable, 2) managing the storage
of collected data, 3) ensuring that
needed data is collected, 4) ensuring
the security of collected data, and 5)
making the different silos of collected
data available.
• The solution to a great deal of
data management challenges
is DataOps—the discipline
connecting data creators with
data consumers. Only an average
of 10% of organizations report
having implemented DataOps fully
across the enterprise. A majority of
respondents say that DataOps is
“very” or “extremely” important.
• Along with other data
management solutions, DataOps
leads to measurably better
business outcomes: boosted
customer loyalty, revenue, prot,
and a host of other benets.
• Improving data security is the
most important factor driving the
changes to how organizations
manage central storage needs.
• Two thirds of survey respondents
report insufcient data security,
making data security an essential
element of any discussion of
efcient data management.

RETHINK DATA: PUT MORE OF YOUR BUSINESS DATA TO WORK—FROM EDGE TO CLOUD | 6 |
Global
Findings
SECTION ONE
RETHINK DATA: PUT MORE OF YOUR BUSINESS DATA TO WORK—FROM EDGE TO CLOUD | 7 |
CHAPTER ONE
The planet’s population is at 7.8
billion and it keeps growing. More
and more people work from home.
Technologies like the Internet of
Things (IoT), the growth of edge
computing, edge data centers,
and articial intelligence (AI)
proliferate. Demand for consumer
endpoint devices is growing.
All these factors result in the
proliferation of enterprise data.
In order to smartly manage the ever-
accelerating amount of information,
business owners need to understand
how and where data is gaining in
volume. Two concepts help illustrate
this trend: growth and sprawl.
Data growth refers to the
percentage by which the
datasphere increases over time.
The datasphere is humanity’s ever-
expanding dimension of living data
that reects and amplies life in
innite ways.
Data sprawl describes the spread
of this growing data through
various congurations—from
endpoints through edge to cloud.
Data is who we are, who we have
been, and who we are becoming.
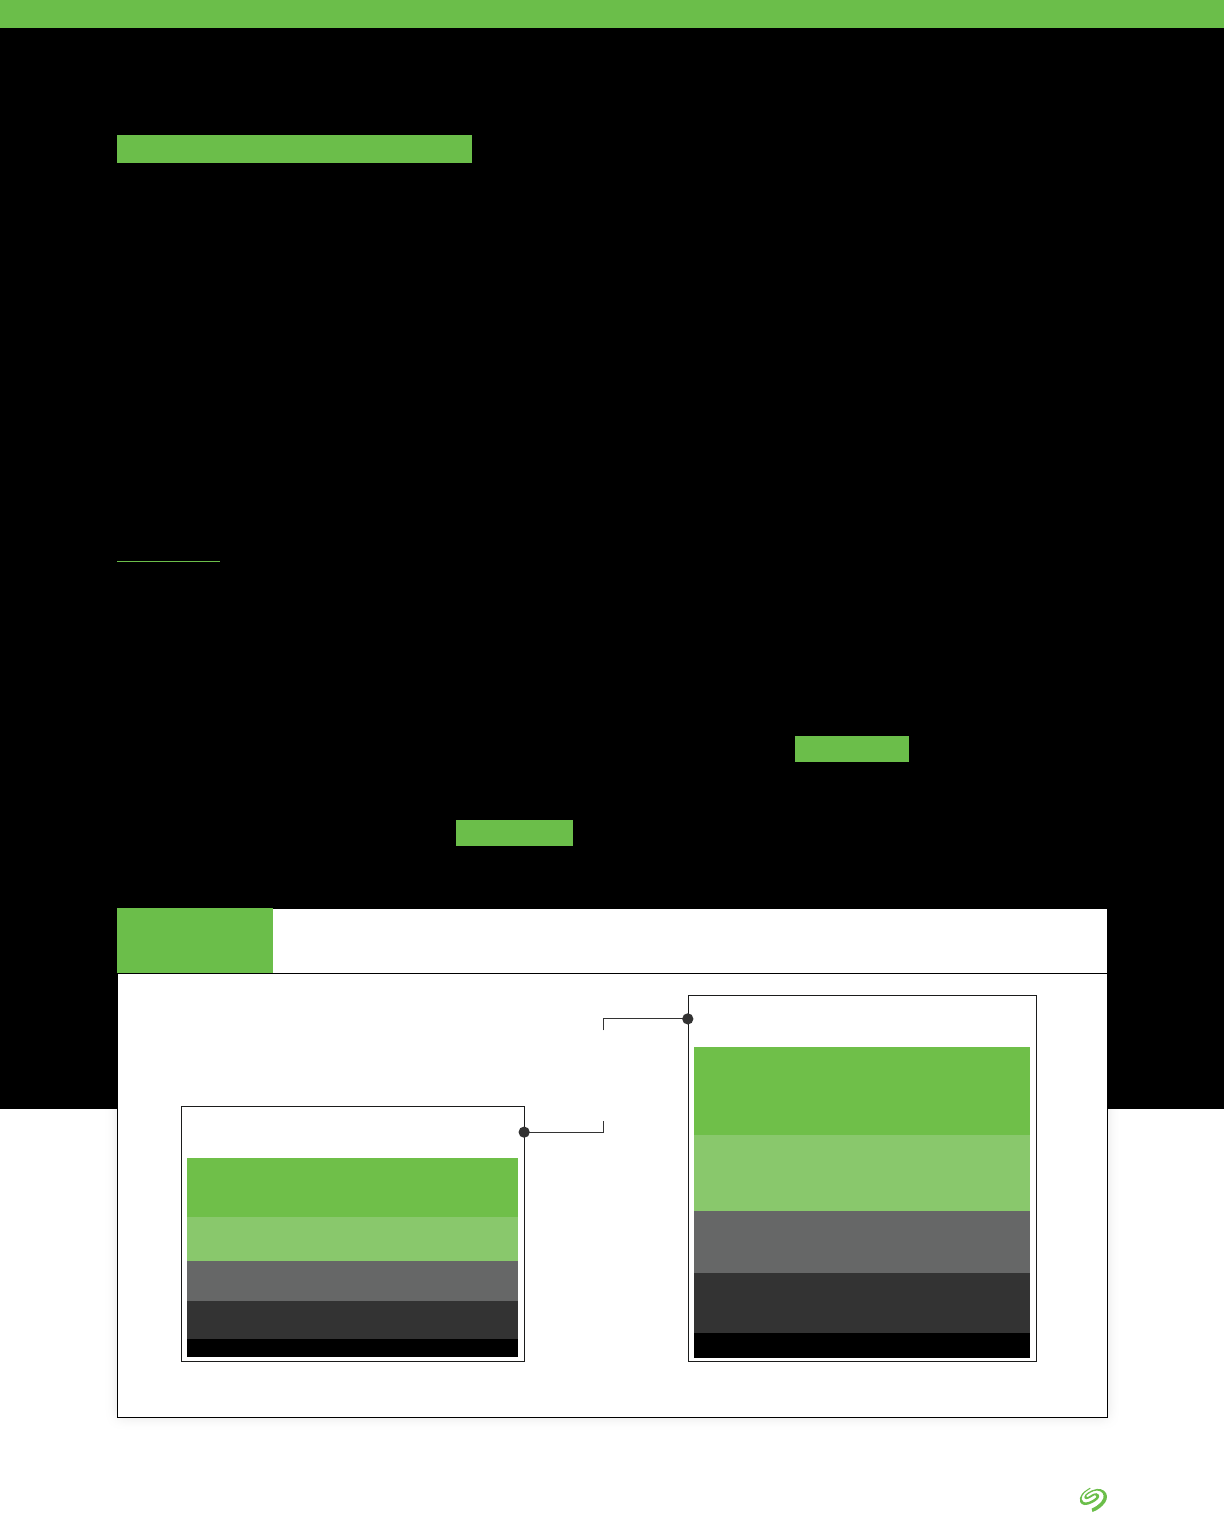
The Growth and the
Sprawl of Data
2020: Total Enterprise Data
Volume of 1PB
160TB in other locations
390TB in edge & remote locations
407TB in 3rd-party data centers
498TB in cloud repositories
(public, private, industry)
570TB in internally managed
data centers
89TB in other locations
193TB in edge & remote locations
201TB in third-party data centers
221TB in cloud repositories
(public, private, industry)
297TB in internally managed
data centers
2022: Total Enterprise Data Volume
of Approx. 2.02PB
+42.2%
avg. annual growth
over 2 years
Expected Annual Data Growth Rate
FIGURE 1
SEAGATE POV
Source: The Seagate Rethink Data Survey
1
, IDC, 2020
1 The Seagate Rethink Data Survey by IDC is IDC’s name for the survey whose ndings are discussed in this report.
RETHINK DATA: PUT MORE OF YOUR BUSINESS DATA TO WORK—FROM EDGE TO CLOUD | 8 |
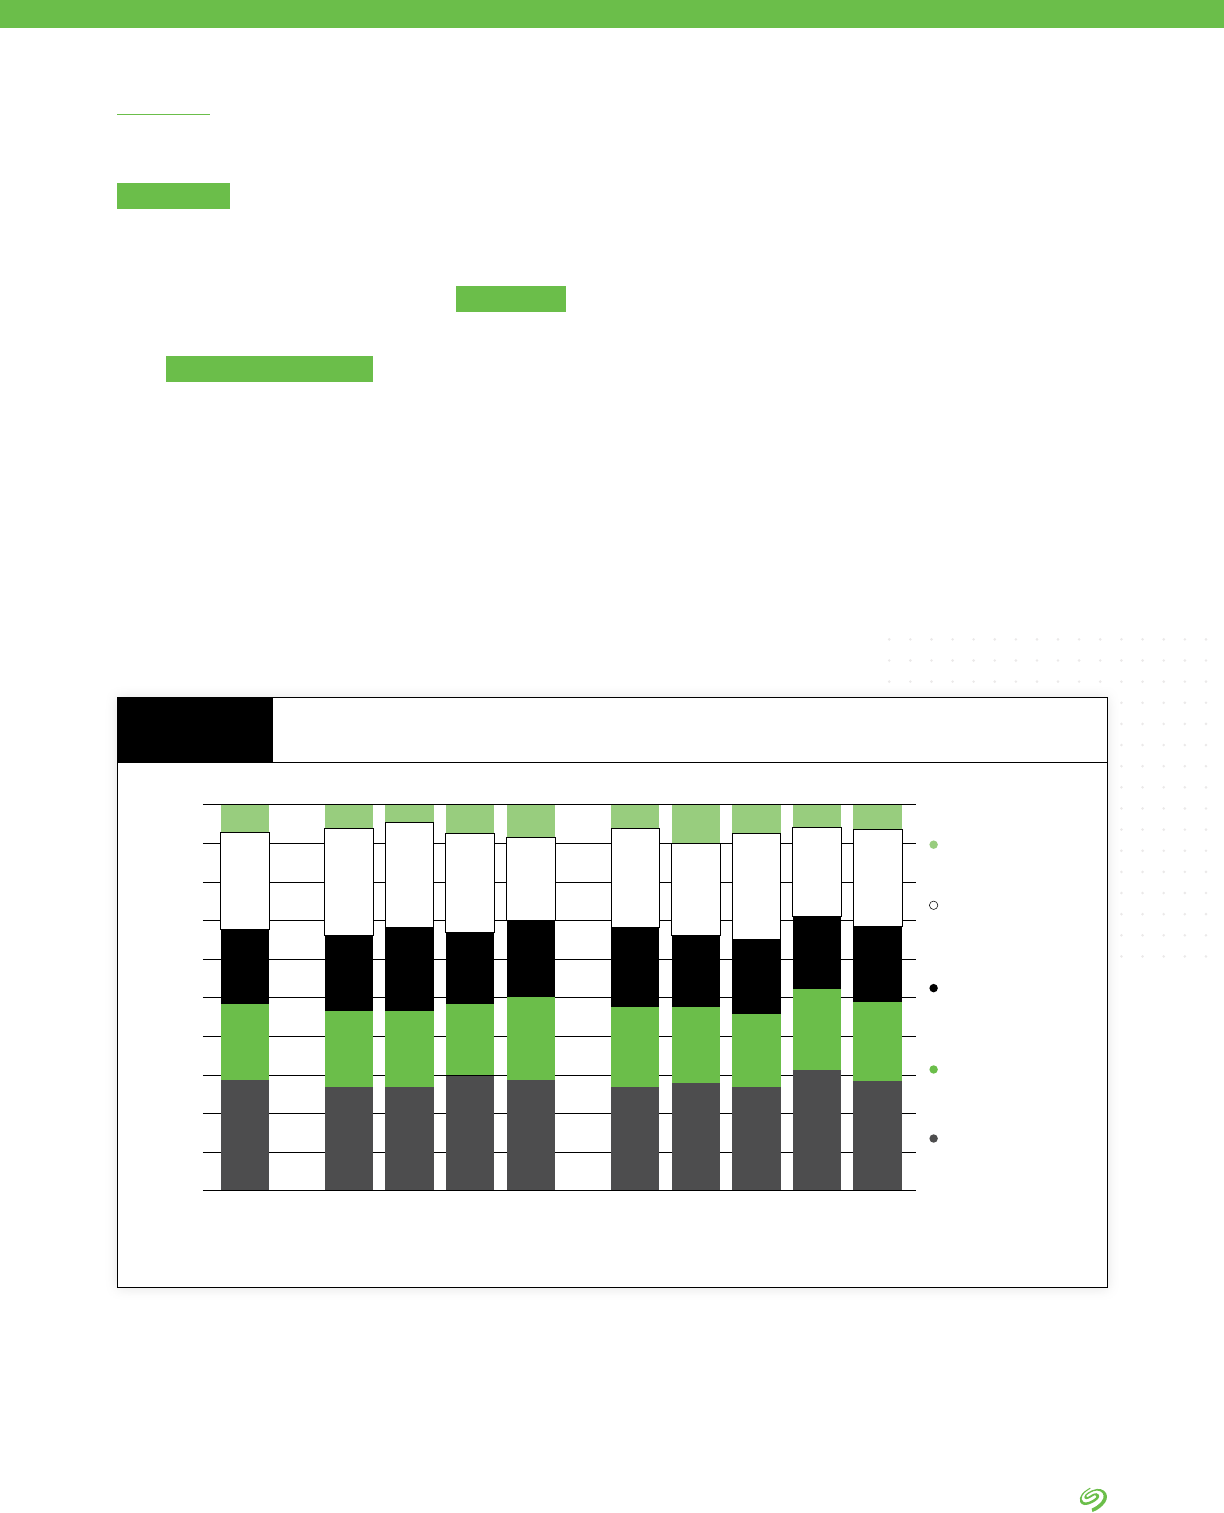
100%
90%
80%
70%
60%
50%
40%
30%
20%
10%
0%
Total NA China Europe APJ TelcoTrans/EV Media Mfg Other
Internally managed
enterprise data
centers
Third-party
managed enterprise
data centers
Edge data centers
or remote locations
where data is
centrally stored
Cloud repositories
(public, private,
industry)
Other locations
Data growth has been and will
continue to be unprecedented in
volume. The survey conducted
shows that in just two years, from
the beginning of 2020 through the
beginning of 2022, enterprises will
see a 42.2% annual increase in the
volume of generated data. In order
to project the volume of enterprise
data, IDC uses enterprise storage
capacity as a proxy (Figure 1).
The survey data indicates that three
factors are the most important
catalysts for the growth of stored data:
1. Increasing use of analytics.
2. The proliferation of IoT devices.
3. Cloud migration initiatives.
Data sprawl reects how business
data is scattered.
Enterprise data doesn’t reside in one
location, which adds complexity to
data management.
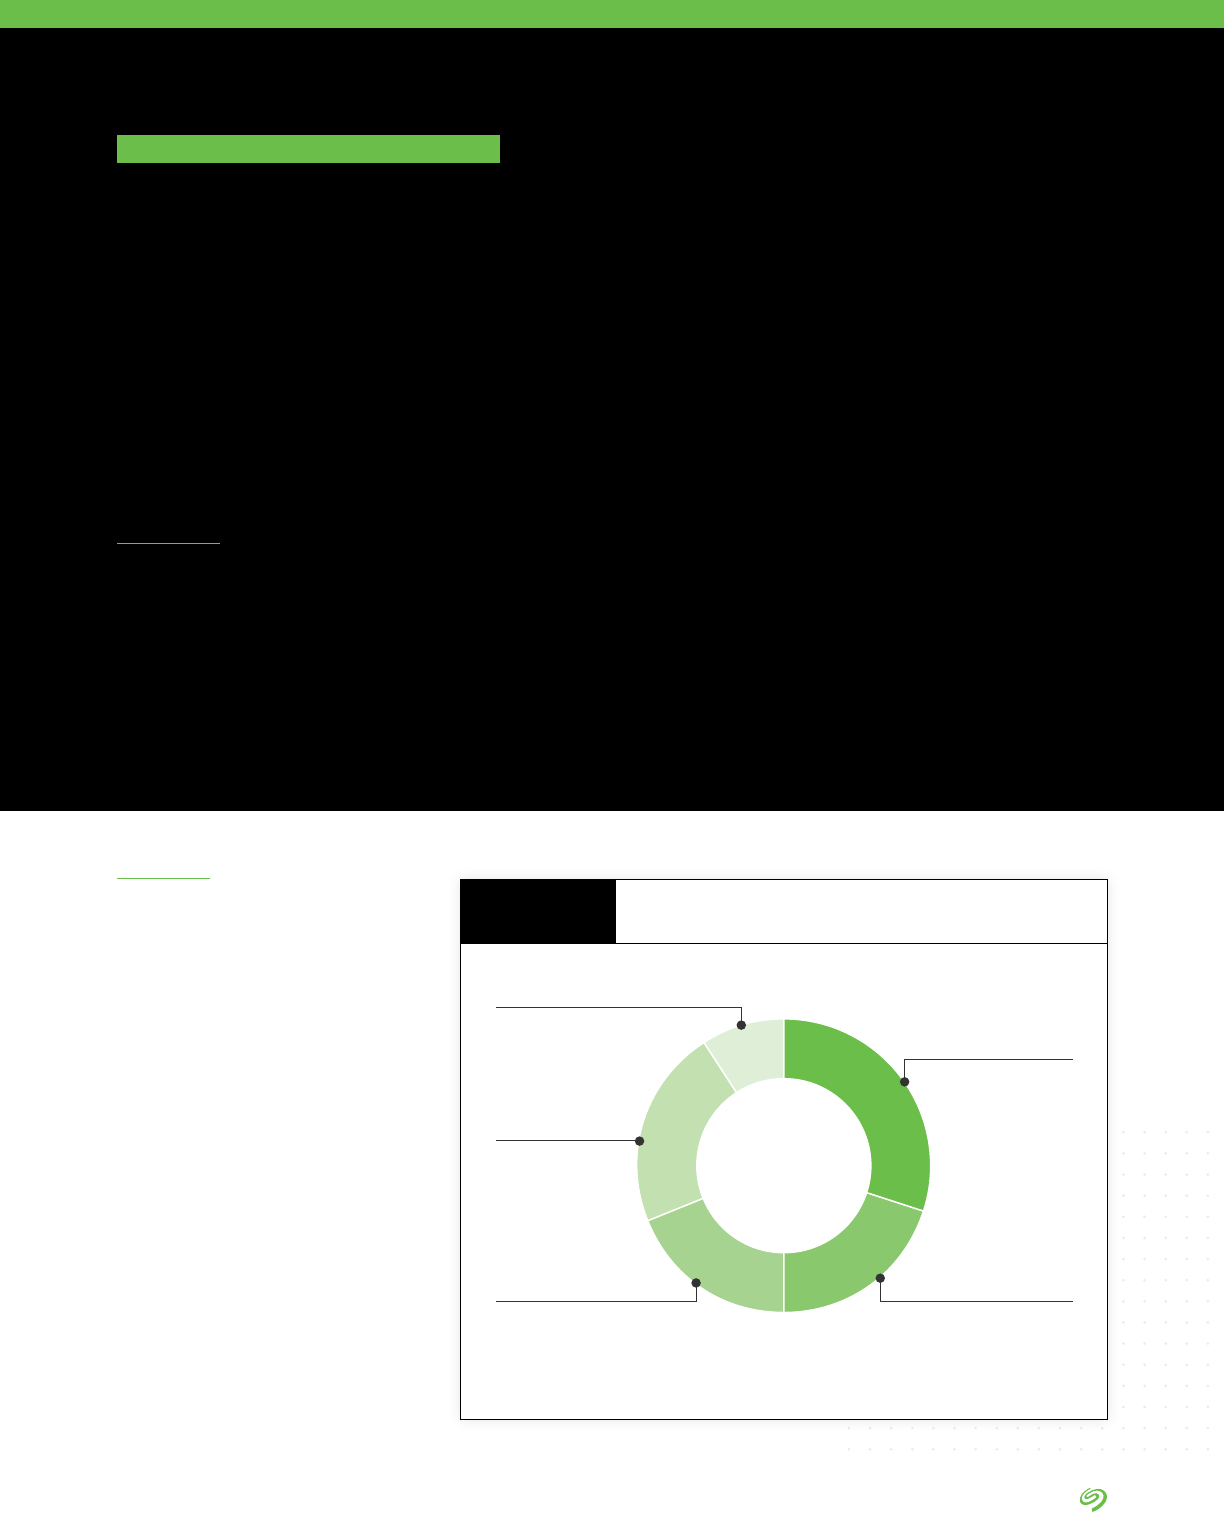
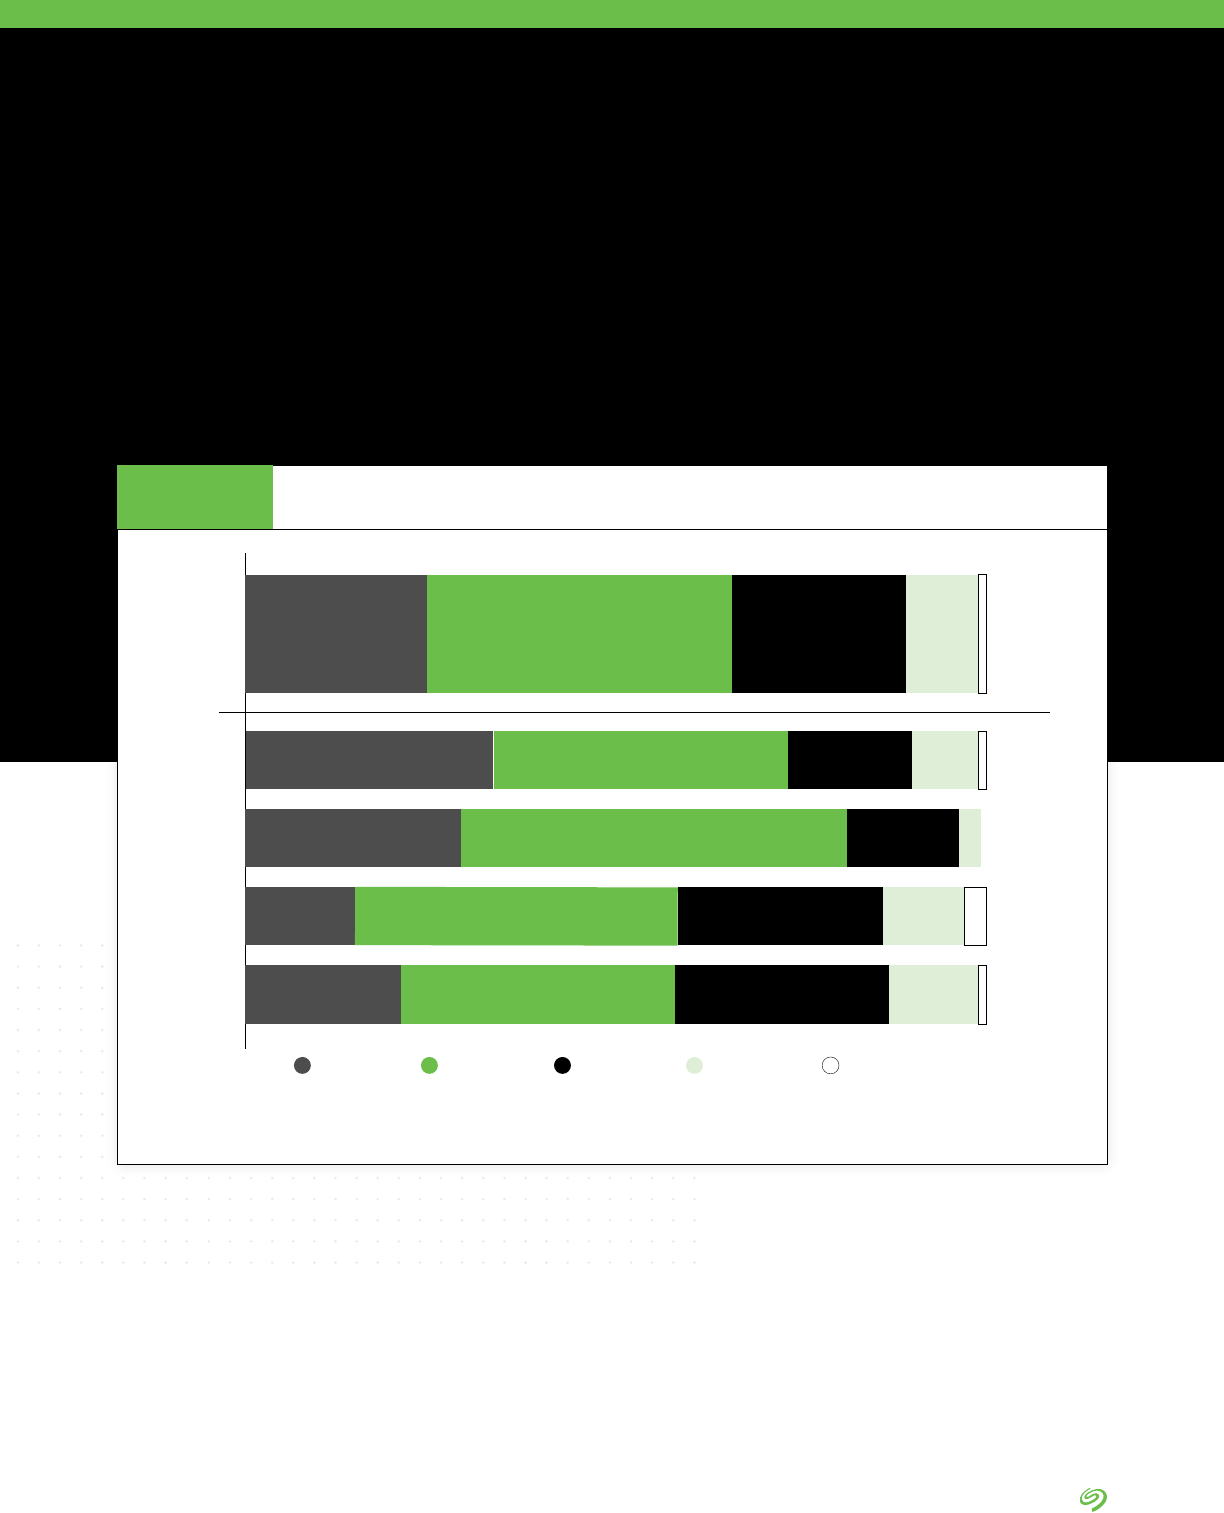
Survey respondents indicate
that approximately 30% of
stored data is found in internal
data centers, 20% in third-party
data centers, 19% in edge data
center or remote locations, 22%
in cloud repositories, and 9% in
other locations. This distribution
won’t change signicantly over
the next two years, indicating that
enterprise storage environments
will remain dispersed and complex
for the foreseeable future.
Enterprises will have an ever-
increasing need to manage this
scattered data wherever it exists.
Survey Findings
Where Data Will Be Stored in 2 Years (Average)
FIGURE 2
DATA BY IDC
Source: The Seagate Rethink Data Survey, IDC, 2020

RETHINK DATA: PUT MORE OF YOUR BUSINESS DATA TO WORK—FROM EDGE TO CLOUD | 9 |
Innovation is not driven by trends, but by the need to create more
value under constraints—and there are constraints everywhere.
Access to the full value of data is one of them.
Take a look at our data-driven world. Data is growing, and the
rate of growth is accelerating. The sum of data generated by 2025
is set to accelerate exponentially to 175 zettabytes. More data is
created per hour now than in an entire year just two decades ago.
Data is human potential. The sharpest minds attempt to harness
the power of data.
The constraints on capturing the full potential of data are both
systemic and operational. At zettabyte scale, there needs to be
a simple, secure, and economic way to capture, store, and activate
data. People who use the data do not want to worry about this.
How can we solve this data management puzzle at scale and
enable other innovations that change the way we live, work,
commute, and take care of our planet?
If we address the opportunities while navigating these constraints
and enable the most value, then does it matter whether the
innovation used the latest trend or not? Trends may capture our
minds, but if the initial excitement does not translate into value for
companies and for humanity, innovation doesn’t take hold.
When we solve problems at scale, we need to bring multiple
worlds together, and invite their synergy.
DAVE MOSLEY
CEO OF SEAGATE TECHNOLOGY
RETHINK DATA: PUT MORE OF YOUR BUSINESS DATA TO WORK—FROM EDGE TO CLOUD | 10 |
Delving Deeper
Additional research done by IDC
as part of the Global DataSphere
1
sheds light on why enterprises will
see so much data growth.
• The amount of new data
created each year is growing at
a compound annual growth rate
of about 26% between 2015
and 2025.
• The number will be up to 175.8ZB
of new data created in 2025
(compared to 18.2ZB in 2015).
• Enterprise data stored in 2025
will amount to 9ZB—while in
2015 was 0.8ZB.
• The Rethink Data survey backs
up this trend: respondents
consistently indicate that for
their organization, enterprise
data capture and storage
are expanding. It indicates
that the increasing use of
analytics, increasing use of IoT
devices, and cloud migration
initiatives are the top three most
important factors impacting the
growth of stored data.
• Leveraging the Global
StorageSphere
2
and Global
DataSphere studies, we can
better understand data sprawl.
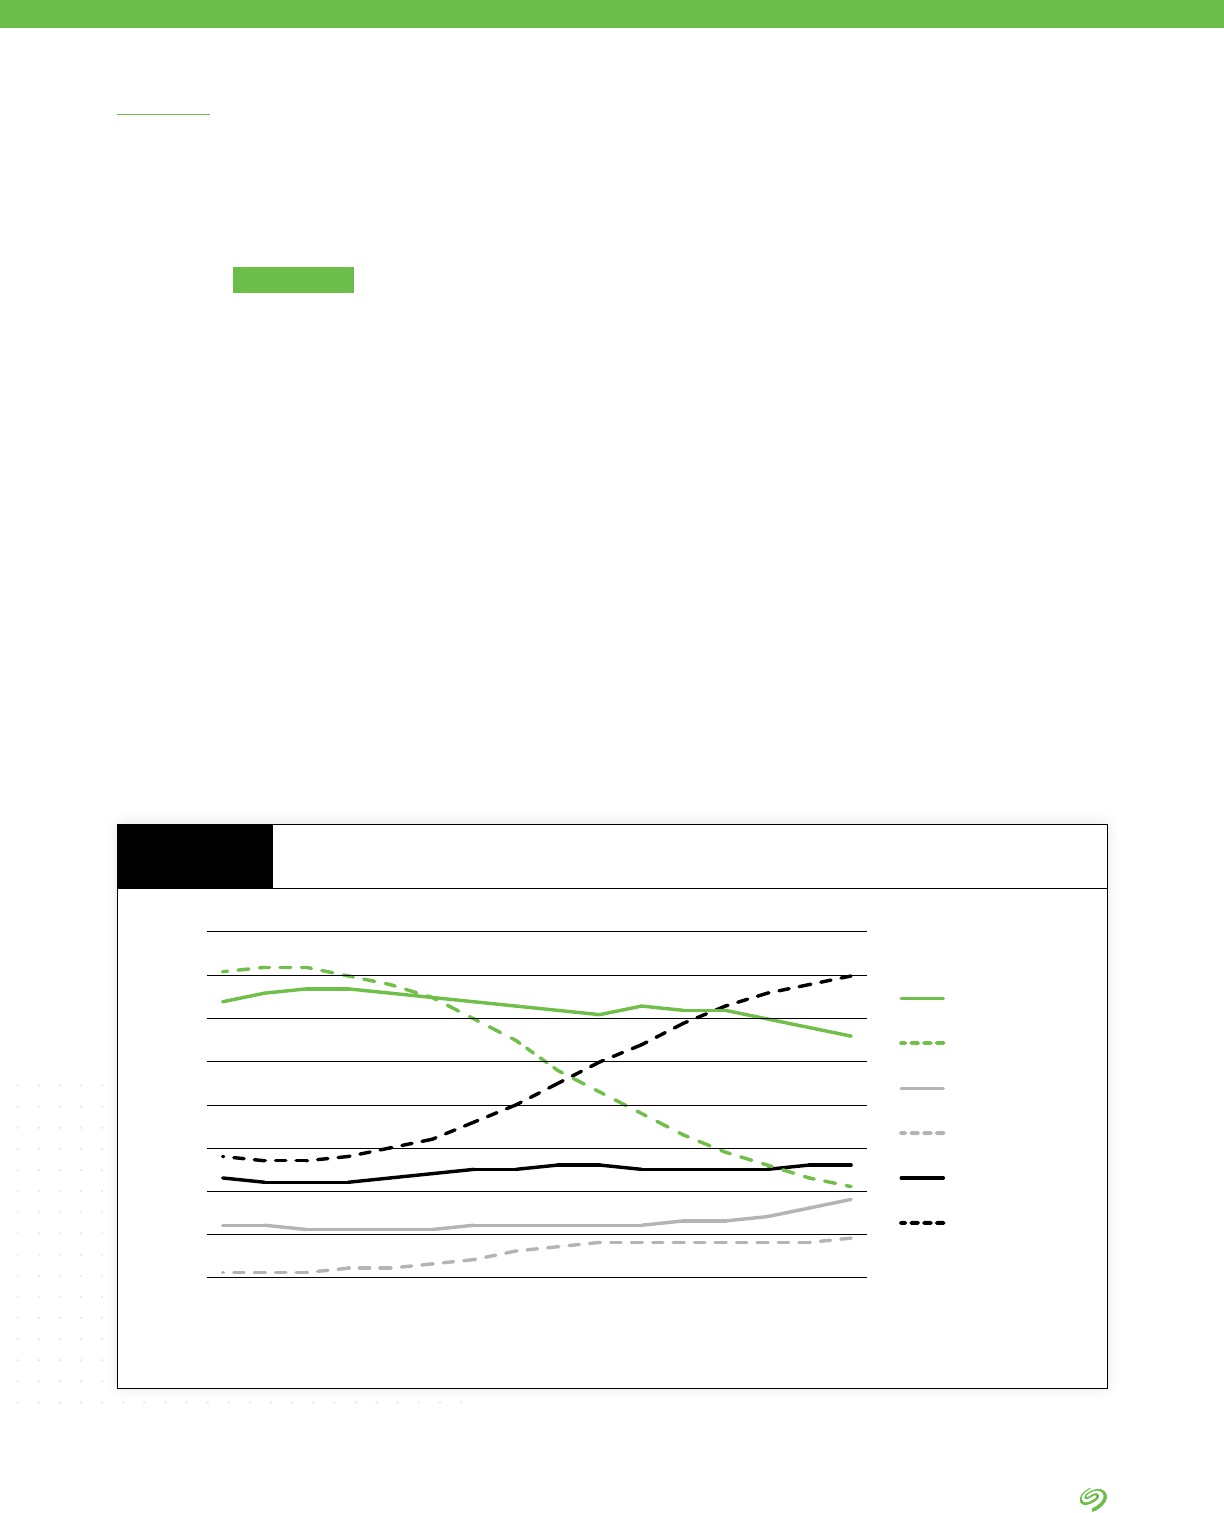
• The Global DataSphere indicates
that 65% of data created in
2015 was at endpoints, and
35% in the core and edge.
• By 2025, the 44% of data
created in the core and edge will
be driven by analytics, articial
intelligence, and deep learning,
and by an increasing number of
IoT devices feeding data to the
enterprise edge.
• Data is shifting to both the core
and the edge: By 2025 nearly
80% of the world’s data will be
stored in the core and edge, up
from 35% in 2015.
• By 2025, IDC predicts 12.6ZB of
installed capacity—HDD, ash,
tape, optical—will be managed
by enterprises. Cloud service
providers will manage 51% of
this capacity.
Endpoint-Create
Endpoint-Store
Edge-Create
Edge-Store
Core-Create
Core-Store
80%
70%
60%
50%
40%
30%
20%
10%
0%
20112010 2012 2013 2014 2015 2016 2017 2018 2019 2020 2021 2022 2023 2024 2025
Where Data Is Created and Stored
FIGURE 3
DATA BY IDC
1 Data Age 2025, sponsored by Seagate, with data from Global DataSphere, IDC, May 2020
2 The Global StorageSphere, IDC, 2020
Source: Data Age 2025, sponsored by Seagate, with data from IDC Global DataSphere and StorageSphere, May 2020

RETHINK DATA: PUT MORE OF YOUR BUSINESS DATA TO WORK—FROM EDGE TO CLOUD | 11 |
The edge can be found anywhere
and everywhere, in a wide range
of locales, including:
• Floors of manufacturing plants
• Roofs of buildings
• Cell phone towers in the eld
• Barns on farms
• Autonomous vehicles
• Platforms at oil and gas elds
The edge is a location, not a
thing. It is the outer boundary of
the network—sometimes found
hundreds or thousands of miles
from the nearest enterprise or
cloud data center, and as close to
the data source as possible. The
edge is where real-time decision-
making takes place.
What Is the Edge?
More and more data needs
analysis and action at the edge.
A unique mix of technology and
economics will make it practical
to assemble, store, and process
more data at the edge.
The shift of data’s center of
gravity to the edge is driven by
four technologies:
1. AI has become cost-effective
and practical.
2. Billions of IoT devices are being
deployed.
3. Wireless operators are upgrading
their networks to the fth
generation of cellular mobile
communications (5G).
4. Innovations in edge data centers
are solving for the complexities
of distributed facilities and unit
cost economics.
In addition to these technologies,
key factors drive demand for
edge computing: latency; high
data volume accompanied by
insufcient bandwidth; cost; and
data sovereignty and compliance.
As massive amounts of data are
created outside the traditional data
center, the cloud will extend to
the edge. It won’t be cloud versus
edge; it will be cloud with edge.
Giving Data an Edge
SEAGATE POV
RETHINK DATA: PUT MORE OF YOUR BUSINESS DATA TO WORK—FROM EDGE TO CLOUD | 12 |
The amount of data stored at the
edge is increasing at a faster rate
than data stored in the core.
This survey found that, on average,
organizations periodically transfer
about 36% of data from the edge to
core. Within only two years this
percentage will grow to 57%.
The volume of data immediately
transferred from edge to core will
grow from 8% to 16% as well. To
accommodate this increase, data
management plans must enable a
much more signicant movement of
data—from endpoints, through edge,
to public, private, or industry clouds.
What does this mean for
enterprises?
It means a greater extent of data
sprawl, which enterprises are
increasingly tasked to manage.
Data sprawl leads to siloed data,
which cannot be accessed by all
who need it. Without automated
methods, managing data sprawl
requires signicant human labor and
redundant tool purchases.
An increasing amount of storage
will be expected to be compute-
conversant—if not, eventually,
offering compute functions.
The edge is expected to store
critical data and insight that
fuels latency-sensitive requests
from endpoint transactions and
services. At the same time, the
edge will make possible distributed
computing to perform analysis of
streaming data.
Streamed data is likely to be cached
in storage media until the servers
complete analytics.
As such, the line between
storage and caching of data at
the edge may become blurred,
especially given the expectation that
data will be stored for only a short
period of time until it is analyzed or
processed before moving relevant
data to the core.
In Focus: Data at the Edge
ANALYSIS BY IDC
Periodically
transferred to core
2020
Immediately
transferred to core
Mix of models
2022
Collected and
stored at edge
2022
2020
2022
2020
2022
2020
2022
2020
14%
8%
38%
15%
36%
57%
8%
16%
Approach to Collecting Data at the Edge
Now vs. Two Years From Now
FIGURE 4
Source: The Seagate Rethink Data Survey, IDC, 2020

RETHINK DATA: PUT MORE OF YOUR BUSINESS DATA TO WORK—FROM EDGE TO CLOUD | 13 |
CHAPTER TWO
Winning enterprises know that how
they treat their data can directly
translate into business growth.
To businesses entrusted with
data—for example, cloud
providers, smart devices
manufacturers, hospital networks,
streaming networks, grocery store
chains, just to name a few—data
means investment into collecting,
analyzing, and storing data in
various repositories.
The more they can leverage their
investment by putting that data
to use, the more value they will
derive from it.
The datasphere contains an ever-expanding
kaleidoscope of human endeavors: urgent life-
critical information, histories of knowledge,
operational instructions, manufacturing
processes, chronicles of emotion, etc.
Data is a treasure trove of value.
A Treasure Trove of Value
SEAGATE POV
RETHINK DATA: PUT MORE OF YOUR BUSINESS DATA TO WORK—FROM EDGE TO CLOUD | 14 |
Missing Out on Data
The Rethink Data survey has found
that organizations report that much
of their business data is not put
to use, or activated. While the data
offers value, that value too often
goes uncaptured.
• Survey respondents estimated
their organizations collect only 56%
of the data potentially available
through its operations. This means
organizations are missing out on
almost half of data.
• Out of that 56%, only 57% of data
was used by the organization.
• 43% of the captured data went
largely unleveraged.
• This means that only 32% of the
data available to enterprises
was put to work. As much as
68% of data goes unleveraged.
of captured data
is exploited
57%
43%
of data goes
uncaptured
44%
of data is captured
through operations
56%
remains
largely unused
How Much Data Actually
Gets Put to Work?
FIGURE 5
DATA BY IDC
Source: The Seagate Rethink Data Survey, IDC, 2020

RETHINK DATA: PUT MORE OF YOUR BUSINESS DATA TO WORK—FROM EDGE TO CLOUD | 15 |
Overall, for many organizations,
data is an understated, intangible
asset that is not represented
on the balance sheet—even
though data is increasingly being
leveraged to drive new sources
of revenue and improve customer
experiences and operational
efciencies. Simply stated, data
can increase enterprise value even
without being formally represented
in nancial statements.
However, to realize the value of
data, it must be put to work. The
survey established that only 32%
of the data available to enterprises
was leveraged.
Putting data to work and unlocking
its value rst requires a method for
measuring the value of the data itself.
In a survey conducted for Seagate in
2018
1
, IDC found that the workforce
in only 25% of organizations
worldwide had systems and
processes for actively quantifying the
value of enterprise data, at least in
certain situations.
Opportunities abound for
organizations to better leverage
data for competitive advantage.
In the same survey, only 11% of
all organizations reported that
they considered themselves to be
industry leaders in the ability to
leverage the value of corporate data
compared to other organizations
in their industry. The percentage
was even lower for the healthcare
and transportation industry
verticals, where fewer than 10% of
organizations identied themselves
as industry leaders.
One thing is certain: Companies
want to have vibrant data lakes
where fresh data is taken in
and old, stale data is moved to
low-cost storage domains. No
company wants their data lake
to turn into a data swamp where
unleveraged yet potentially
useful data sits dormant on
storage media.
The value of data for any given
enterprise involves numerous
variables, including the industry
within which it is created, the
purpose it serves, and if and how it
is eventually monetized.
Take, for example, the types of
data created and managed by a
hospital: patient data, scheduling,
insurance and billing data, MRIs,
cancer treatments, operations and
nancial data, and advertising.
Regulations require that hospitals
keep data for many years after
the death of a patient (this is likely
dormant data that potentially can
be leveraged). The value of each
dataset will vary, especially data that
is highly secure due to privacy and
compliance requirements. In the
future, video sessions for remote
care, the surgeon’s actions during an
operation, or even robotic operation
procedures will be recorded and
saved for a variety of reasons—even
if only to serve for instructional or
legal purposes. Can one really place
a value on this data?
IDC has yet to fully quantify the
value of the global datasphere.
Nevertheless, making some general
assumptions about the value of a
byte created in a hospital with a staff
of 1000 to 2500 and revenues of
over $1B, IDC believes it is likely the
value of data created at that hospital
could be approaching several
hundred million dollars.
The Value of Data
ANALYSIS BY IDC
1 Worldwide DATCON and VoB surveys, IDC, September 2018

RETHINK DATA: PUT MORE OF YOUR BUSINESS DATA TO WORK—FROM EDGE TO CLOUD | 16 |
Every business is a data business. But enterprise data is of little
value if it is not used. To efciently and smartly make sense
of data, we need to see data lakes as reservoirs where many
vibrant rivers meet; the task is to comingle the incoming
data currents. There is a need to share data with other lakes,
in order to cross-reference and run analytics on disparate
streams of data.
Take autonomous cars. To begin with, there’s value in
analyzing data from one vehicle, and within one company.
Cross-analyzing that one vehicle’s data with vehicles from all
autonomous car companies adds another layer of insight. For
a richer picture, zoom out from there to integrating knowledge
derived from that one vehicle’s data with data that proceeds
from the billions of sensors that make up a smart city. The
fuller picture may be useful to the regional government and
city planners who implement better public safety standards
and trafc ows.
The more pieces you put together, the bigger a puzzle you can
solve. You can tackle a much higher-order problem if you share
data, cross-referencing various streams of information for analysis.
That’s why enabling the movement of data matters. Data needs
to move in order to allow for interconnectedness of data—and the
insights that result.
RAVI NAIK
SENIOR VICE PRESIDENT AND CIO
OF SEAGATE TECHNOLOGY

RETHINK DATA: PUT MORE OF YOUR BUSINESS DATA TO WORK—FROM EDGE TO CLOUD | 17 |
Organizations must be able to
capture the right data, identify it,
store it where it is needed, and
provide it to decision makers in a
usable way.
Activating data—putting it to
work—starts with data capture.
Given the exponential growth
of data due to growing IoT
applications, enterprises do not
currently capture all available
data. To do so would result in
an overworked IT infrastructure
and tremendous costs. Without a
solid data management solution,
companies need to leverage
data ingest software capabilities
to identify and classify data at
the beginning of data lifecycle.
With proper identication and
classication, automated policies
can keep data through its useful
period, and then delete or archive
it when it is no longer needed. This
data pruning lowers costs and
avoids clogging data management
efforts. However, as data
management solution technology
advances, companies can consider
capturing more data, which can be
utilized for improving their articial
intelligence or machine learning.
Data capture then feeds into
data analysis. Most often, it’s
done in data lakes where data
is assessed by specialized data
analysis software based on industry
or other criteria. Data curators
and scientists use these tools to
mine information from the data to
provide to decision makers. Data
ingest into a data lake eliminates
the silos that separate data and
allow connections to be made from
seemingly unrelated data elements.
This is what leads to competitive
advantage.
Storage is integral to an
organization’s data strategy as it is
an active contributor to the process
of sorting and analyzing information.
The need for accurate, real-time
reporting of stored data to improve
workows, security, and resource
management initiatives continues
to drive demand for advanced data
management and analytics solutions.
Putting Data to Work
“Whether structured,
semistructured,
or unstructured;
generated by humans
or by machines; or
stored in the data
center or the cloud,
data is the new
basis of competitive
advantage.”
PHIL GOODWIN
RESEARCH DIRECTOR, IDC
At the Edge
Edge devices pose a particular challenge for data capture. Often, only the edge application knows what data
needs to be captured and acted upon, and what data is transient and thus can be ignored. A lot of decision-
making has to happen close to where data is created. But the newer centralized data management ingest
applications can leverage articial intelligence (AI) and machine learning (ML) to make the determination. These
programs can often identify sensitive data (like personally identiable information, private health information, credit
card numbers, etc.) and automatically mask them from the view of unauthorized personnel. This reduces the
chance of a data breach or inadvertent data disclosure.
ANALYSIS BY IDC

RETHINK DATA: PUT MORE OF YOUR BUSINESS DATA TO WORK—FROM EDGE TO CLOUD | 18 |
Storage Innovation and the Value of Data
How and where data is stored
can greatly affect the value that
organizations can derive from it.
Here are areas in which storage
innovations bear directly on the
value of data.
1. Mass capacity is the enabler of
economies of scale. Analytics
improve as the data sets
that they access grow. Good
data management includes
ensuring that any new AI or ML
breakthroughs have access
to all of the data (as much as
physically possible). That is
why data storage companies
like Seagate focus on the
development of areal density
growth (so devices can store
more on a given unit).
The focus on areal density
innovation is based on data from
the world’s largest clouds.
Companies distribute data
roughly along the 90/10 rule:
90% of their data is stored on
hard drives and 10% on ash
memory devices (SSDs).
2. Another focus of storage
innovation has been delivering
higher bandwidth in order to
catalyze more robust movement
of data among storage,
networking, and compute
functions. This is important
for analytics. The backbone of
today’s analytics is the GPUs
(graphics processing units).
They require high bandwidth
ingest of information. To improve
bandwidth, for example,
organizations use composable
disaggregated architectures in
large-scale AI applications.
3. Security is another area of
innovation. There is continued
investment in device integrity
through open enclaves for
making rmware and compute
carry and house appropriate
protocols to digitally verify
devices. System solutions
benet from securities at the
component and device level.
Networking’s security benets
from the system’s security.
Finally, compute is made more
secure as a result of more
security networking.
4. In the longer term, data
movement architectures will
need to ensure that hardware
acceleration or hardware ofoad
through the storage systems
is done at appropriate points.
Specically, compression,
encryption, and deduplication
of data sets today get done
in compute. As a result, big
architectures are having to scale
because these tasks are done at
the higher level. This need not be
the case if innovation moves the
hardware acceleration and ofoad
to the storage or network layer.
5.
6.
SEAGATE POV

RETHINK DATA: PUT MORE OF YOUR BUSINESS DATA TO WORK—FROM EDGE TO CLOUD | 19 |
CHAPTER THREE
Enterprises often struggle with
access to some of their data that
resides in the public cloud. They
also have a hard time with moving
data out of the cloud—not to
mention the fees that come with
the retrieval. This can stand in the
way of deriving optimum value from
data in the public cloud context—
because to be valuable, data has
to move. As a result, enterprises
increasingly mix up their storage
options, choosing to manage data
in the multicloud ecosystem.
Multicloud means the use of
more than one public cloud, which
is orchestrated through data
management. It may also include
a private cloud component. In
practice, multicloud can mean that
an enterprise houses some data in
public clouds and some in on-prem
private cloud.
Repatriating some data to private
cloud ensures a mesh of benets
from private cloud and from the
multicloud ecosystem.
1. Predictable economics at scale, which are under an enterprise’s control.
2. IP ownership, protection, and control of where that data physically
resides. This is useful, for example, in cases of data that needs a clear
audit trail or must comply with regulatory requirements.
3. Frequent access to large data sets. This is advantageous because
storage becomes very expensive when businesses need to read and
analyze the data frequently.
4. Compliance with regard to sensitive data sets. For example, life-
critical data that requires a certain provider’s and patient’s locality, as well
as compliance with laws and regulations such as HIPAA and GDPR.
The public cloud has catalyzed the growth of
countless companies. When enterprises reach
scale, however, they nd public cloud alone
too inexible.
The Multicloud
Private cloud offers the following advantages:
SEAGATE POV

RETHINK DATA: PUT MORE OF YOUR BUSINESS DATA TO WORK—FROM EDGE TO CLOUD | 20 |
1. Fast growth and scale. In the multicloud, teams can build and deploy
an application or service in a common environment—plus benet from
the resulting revenue stream—without an investment in CapEx to do so
globally.
2. Access to a broad catalog of services that include applications,
compute, and monitoring resources. The multicloud features the ability
to turn on a high-performance compute that would be unaffordable
in most private clouds. GPUs can run between $500 thousand and
$5 million. Access to the public cloud means businesses can rent
them, solve a puzzle, and be done with them without leaving them to
sit idle. Access to public cloud compute means maximum compute
horsepower that enables an efciency growth and elimination of
stranded resources.
The public cloud benets that extend to the
multicloud ecosystem include:
Hybrid cloud seamlessly fuses
the resources of private and
public clouds to deliver an
integrated infrastructure as a
service. Hybridization ensures
communication between clouds
and interoperability, or the ability to
work across resource boundaries.
What does it look like? For
example, a company buys an OEM
enterprise service and puts it in a
colocation environment in a shared
building and connects to a cloud
service provider’s protocol on the
back end.
Hybrid cloud tends to be under one
software management portal, which
does the heavy lifting of connect;
the application knows how to talk to
the lead software layer.
In multicloud, the application,
which tends to be built as cloud-
native, knows how to use and run
the resources. Hybrid clouds often
have to gure out how to take
legacy systems and connect them
to the benets of public cloud.
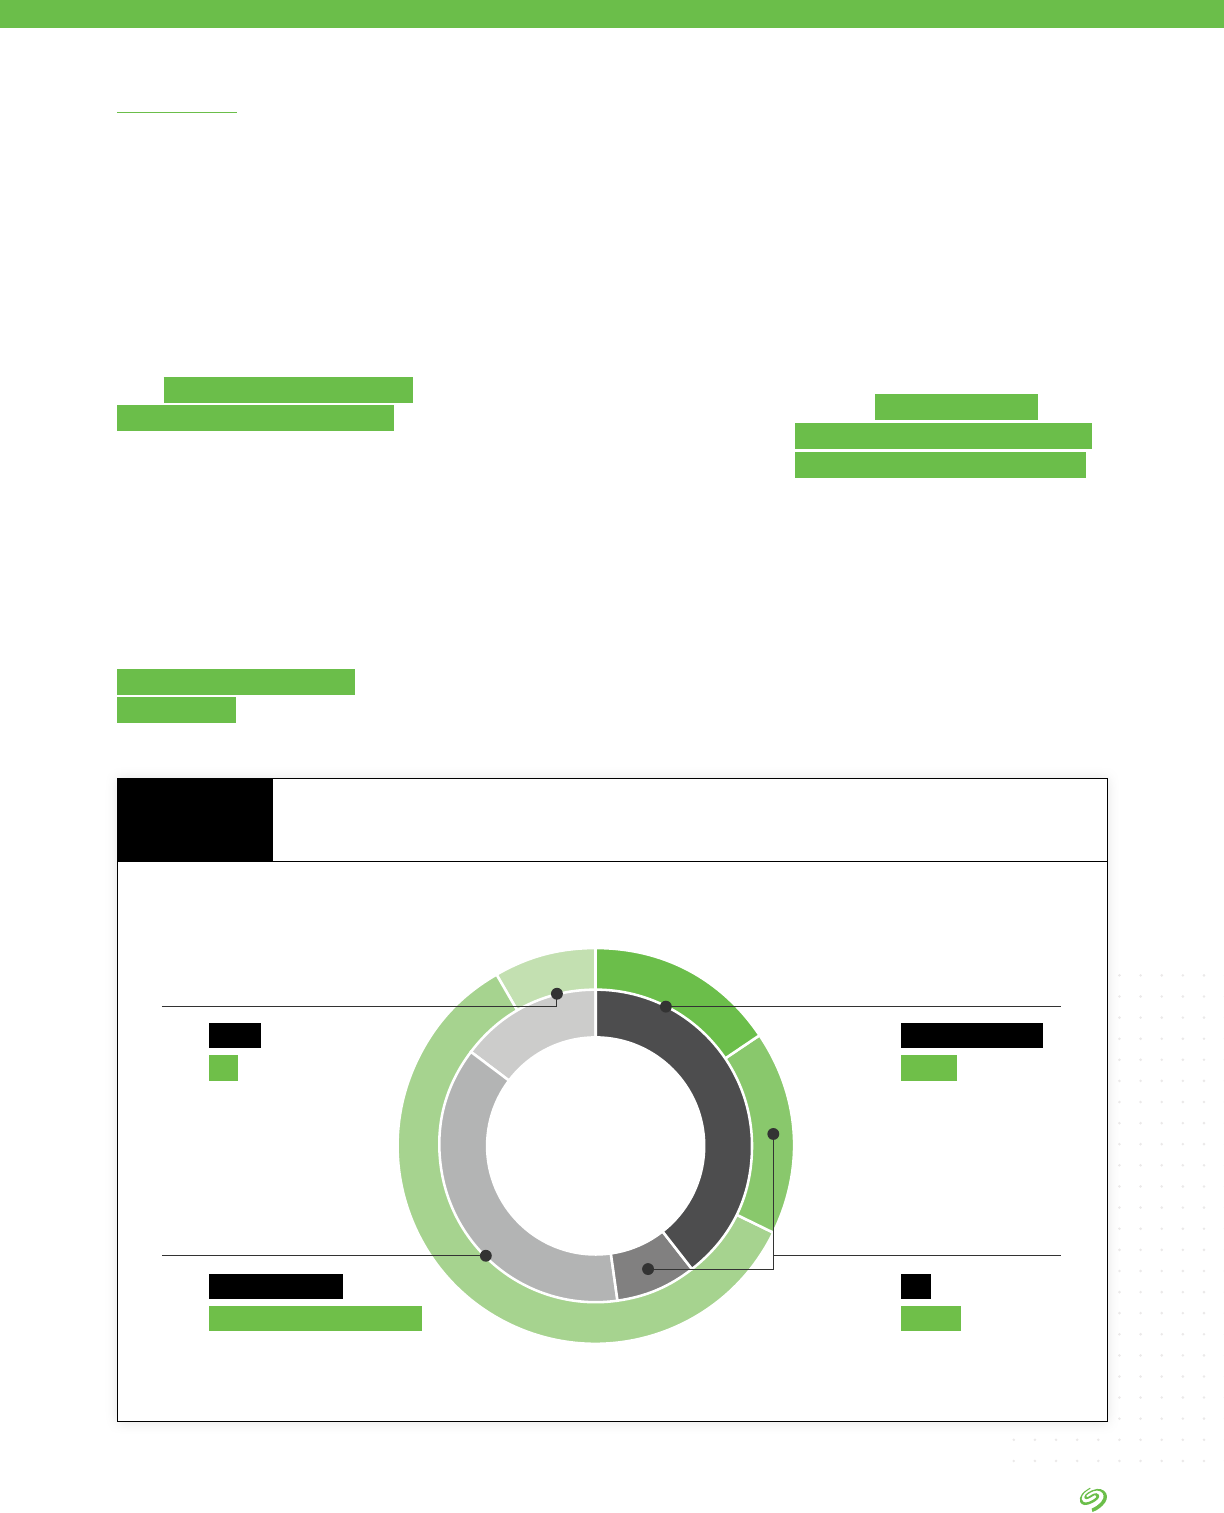
RETHINK DATA: PUT MORE OF YOUR BUSINESS DATA TO WORK—FROM EDGE TO CLOUD | 21 |
50%
Public Cloud
51%
Enterprise Private Cloud
36%
Hosted Private Cloud
37%
Multicloud
37%
Hybrid Cloud
17%
Industry Cloud
1%
Other
IDC analysts describe the multicloud
as “an organizational strategy or
the architectural approach to the
design of a complex digital service
that involves consumption of cloud
services from more than one cloud
service provider.” These may be
directly competing cloud services,
such as public object storage from
more than one public cloud service
provider, or IaaS and SaaS from one
or more cloud service providers.
According to IDC, in both of these
contexts, multicloud encompasses
a much larger universe than
does hybrid cloud and is only
gated by the cost and complexity
associated with enabling consistent
management and governance of
many different cloud options.
Multicloud as Organizational Strategy
Which of these cloud types is used in the
organization’s IT infrastructure?
FIGURE 6
Managing Data in More Than One Cloud
Survey respondents indicate a
wide range of cloud deployments,
including adoption of multiple cloud
service providers:
• The study reveals an equal
adoption of both multicloud and
hybrid cloud deployments (37%
each).
• Hybrid cloud use is typically
application-driven. The use of more
than one cloud develops organically
over time, with different lines of
business purchasing different cloud
providers for specic tasks.
• Businesses using multicloud
report that they do not necessarily
have a cohesive integration plan
for the long term.
• Multicloud and hybrid cloud
environments solve a number
of different problems. They
can make access to data and
analysis easier, cut costs, offer
administrators better control, and
boost data security.
But multicloud and hybrid cloud
ecosystems also pose some
challenges when it comes to
data management.
DATA BY IDC
ANALYSIS BY IDC
Source: The Seagate Rethink Data Survey, IDC, 2020
RETHINK DATA: PUT MORE OF YOUR BUSINESS DATA TO WORK—FROM EDGE TO CLOUD | 22 |
• Managing data in multicloud
environments is the number one
data management challenge
expected in the next two years
by survey respondents.
• Managing data in hybrid clouds
is listed as the second most
important data management
headache.
Takeaways
“Multicloud deployments are much more
difcult to orchestrate and manage
consistently, as the infrastructure tools native
to each cloud platform are typically designed
to operate within the connes of the specic
platform. Furthermore, adjacent services
offered by public cloud providers for data
management or analytics are usually designed
to operate alongside the native public cloud
infrastructure, and may not integrate or be
able to provide full functionality on other
public cloud platforms.”
ANDREW SMITH
RESEARCH MANAGER, IDC
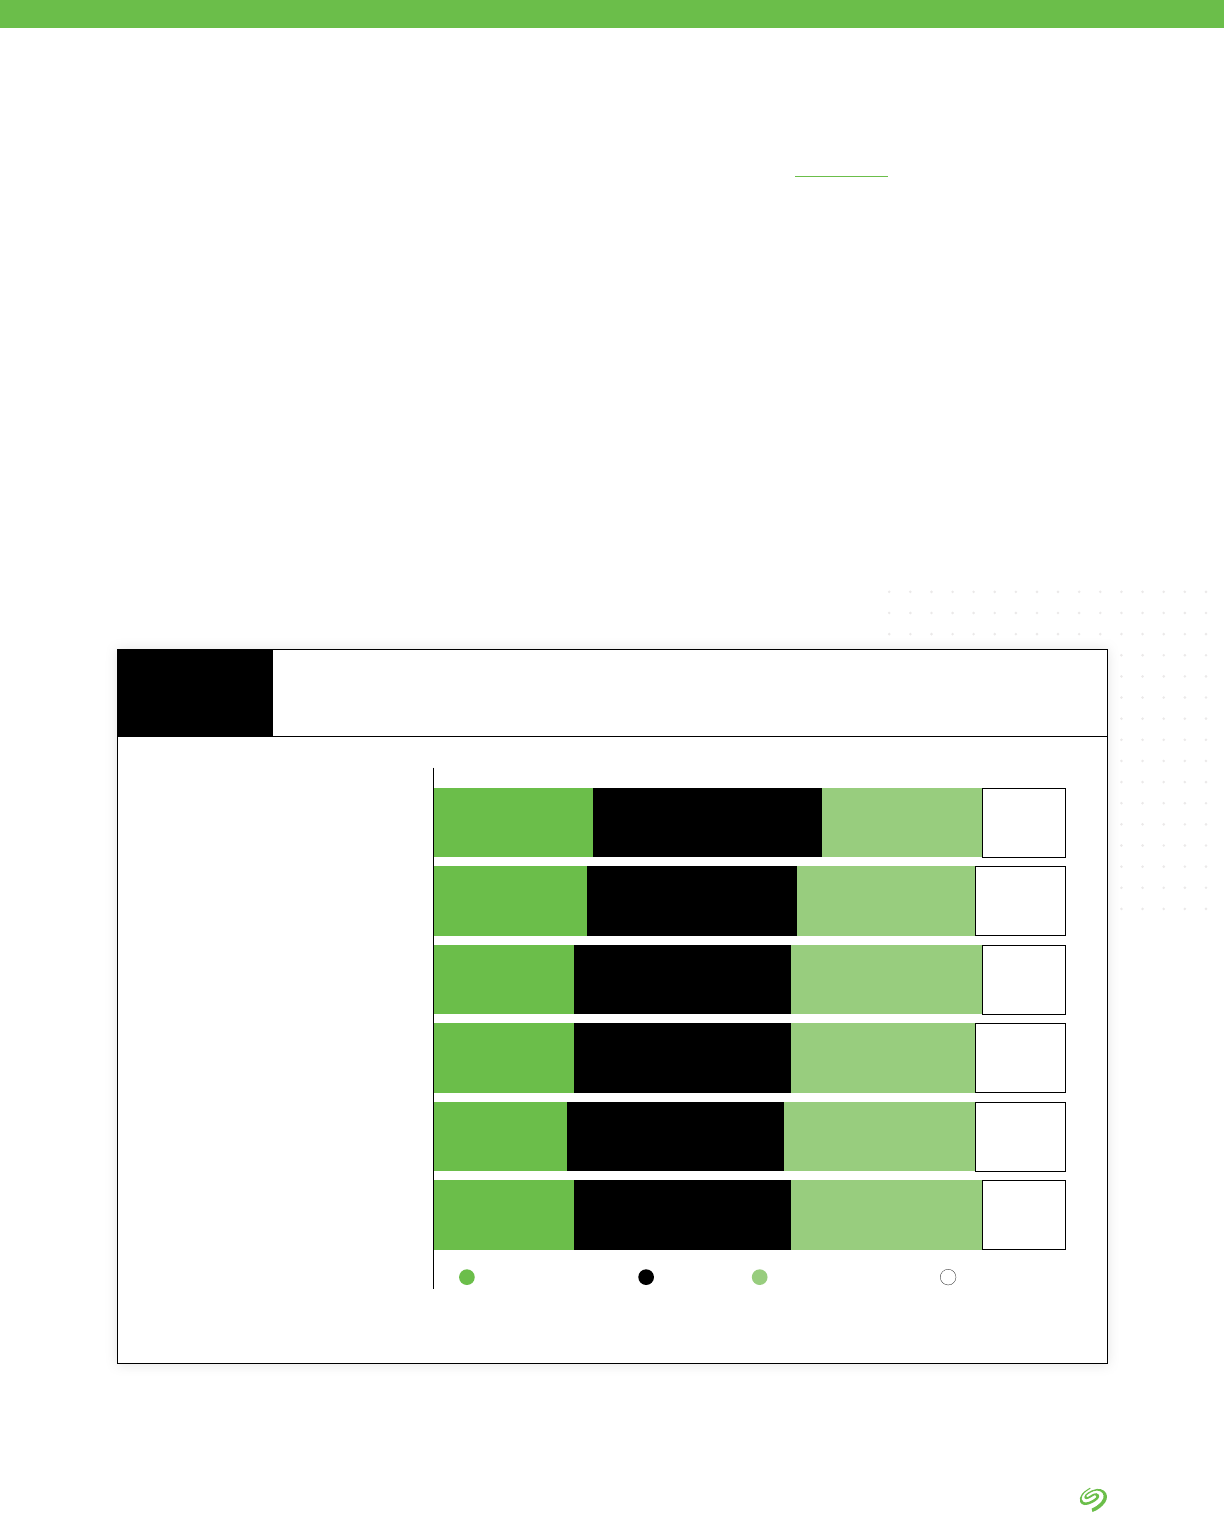
Managing data in multicloud
environments
25% 36% 25% 13%
Managing data in hybrid-cloud
environments
24% 33% 28% 14%
Managing the data connections
between edge and core environments
22% 34% 30% 13%
Deciding what data to keep in what
environments (cloud, on-premise,
edge, etc.)
22% 34% 29% 14%
Getting buy-in to get the resources to
successfully manage data beyond
enterprise data centers
21% 34% 30% 14%
Building or nding the expertise
needed to successfully manage data
beyond enterprise data centers
22% 34% 30% 13%
ChallengingExtremely challenging Somewhat challenging
Not a challenge
Managing Data in More Than One Cloud
Over the Next Two Years
FIGURE 7
DATA BY IDC
Source: The Seagate Rethink Data Survey, IDC, 2020
RETHINK DATA: PUT MORE OF YOUR BUSINESS DATA TO WORK—FROM EDGE TO CLOUD | 23 |
According to IDC’s IaaSView
research
1
, the most common use
case for multicloud is to have an
application on one public cloud
IaaS that regularly interacts with
applications on another public
cloud IaaS. This arrangement may
work at the application level.
But at the data management level,
signicant challenges remain:
• separate workows
• disparate management tools
• lack of unied security
management
• the difculty of sharing and
moving large amounts of data
across multiple cloud providers
These challenges add complexity
and time to even the simplest
data-related tasks, like dashboard
creation and reporting in
multicloud environments.
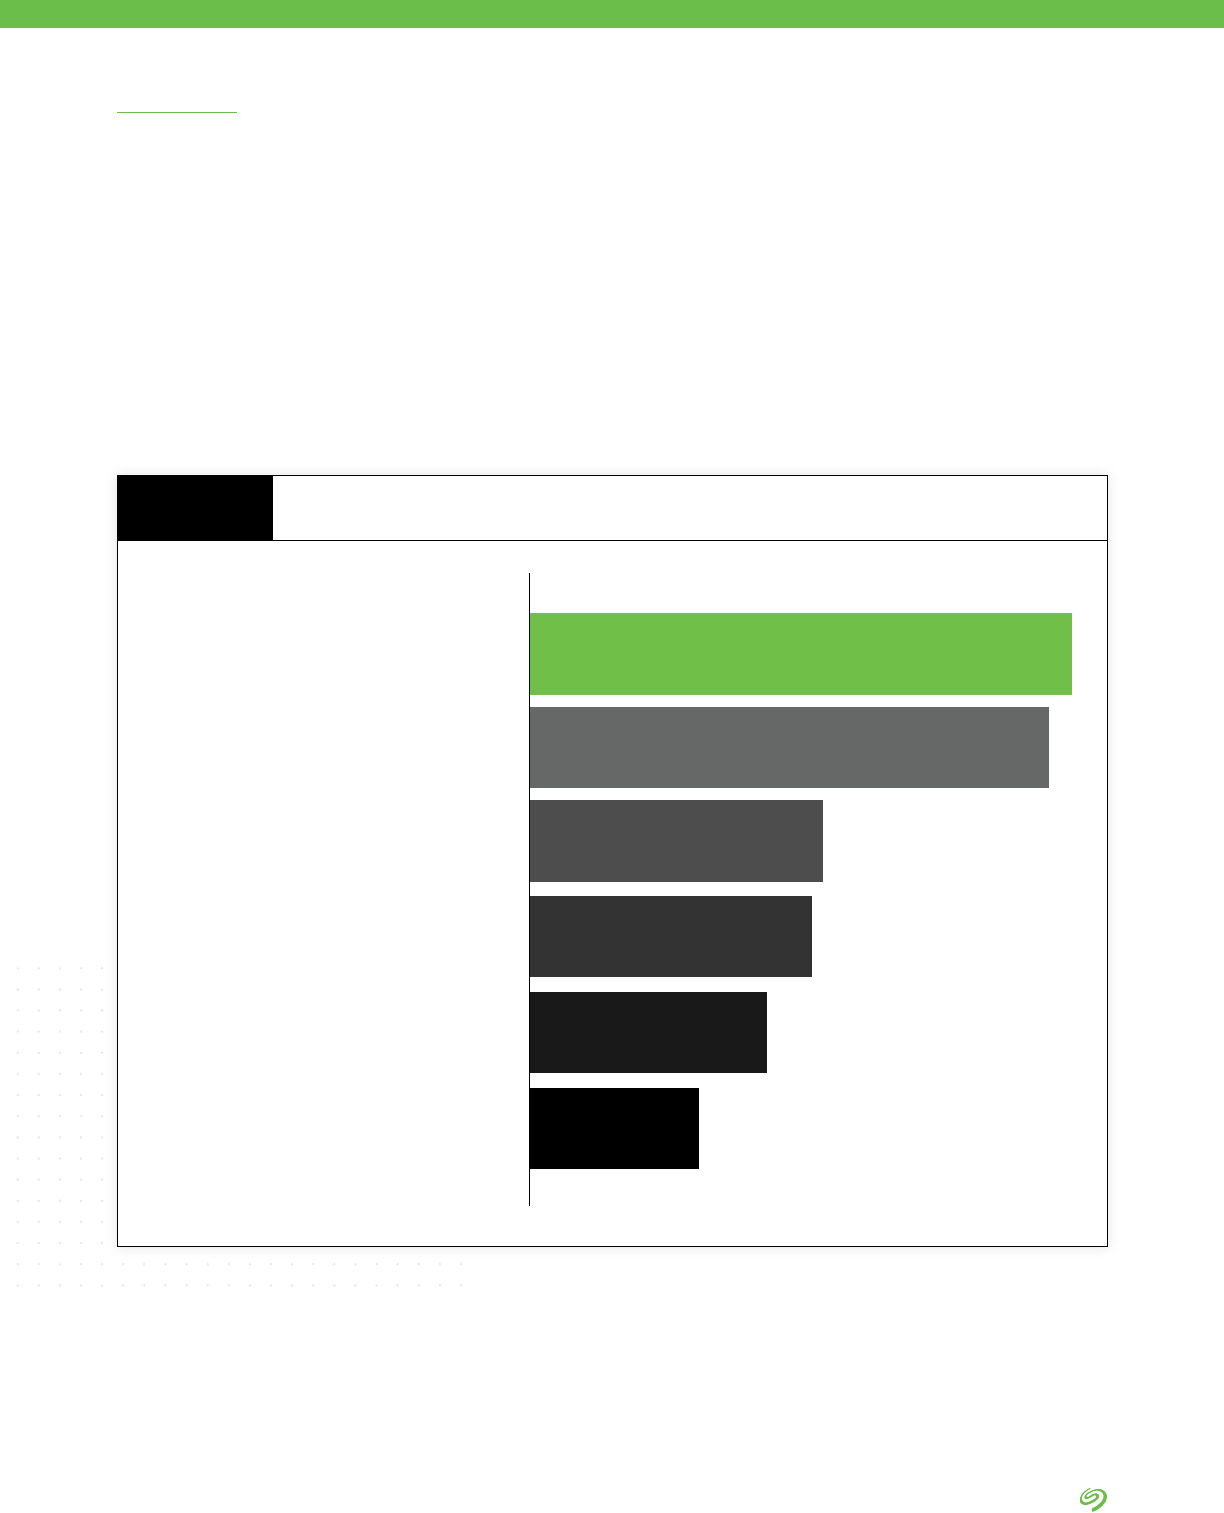
Delving Deeper
Has applications on one public cloud IaaS
that regularly interacts with applications on
another public cloud IaaS
Has applications on one public cloud IaaS
that regularly interacts with applications on
dedicated infrastructure
Has applications that were ported
and/or migrated from one public cloud
IaaS to the other
Has a single set of provisioning,
management, and monitoring tools that
works across all providers
Has similar provisioning and approvals
process across most providers
Is disconnected, with different teams,
provisioning, approvals, management, and
applications for each provider
48%
46%
26%
25%
21%
15%
Level of Integration of Multiple Public Cloud IaaS Providers
FIGURE 8
ANALYSIS BY IDC
Source: IaaSView Survey 2019, IDC
1 IaaSView Survey, IDC, 2019
RETHINK DATA: PUT MORE OF YOUR BUSINESS DATA TO WORK—FROM EDGE TO CLOUD | 24 |
CHAPTER FOUR
So far, this report has
established that:
• Business data contains a great
deal of value.
• Much of this value goes
untapped, costing business
owners potential revenue.
• An impediment to deriving
optimum value from data lies in
businesses not collecting much
of their data.
But there are other reasons why
data management is a challenge:
issues inherent to the multicloud
ecosystem. This chapter sheds
light on these challenges.
Data Management
Challenges and the
Multicloud Ecosystem
Managing Data
The survey has found that when
it comes to managing one of their
most valuable resources—data—
enterprises report being unable to
successfully control the growing
complexities on their own. They
report that they need help with data
management.
A key reason for this is a wide and
relatively even distribution of data
across edge and cloud repositories.
There is some variation: the
transportation and electric vehicles
industry shows most data at the
edge, while the manufacturing
sector stores more data in internally
managed data centers.
DATA BY IDC
Internally managed
enterprise data centers
Third-party managed
enterprise data centers
2020
30%
Other locations
9%
20%
Cloud repositories
(public, private, industry)
22%
Edge data centers
or remote locations where
data is stored
19%
Where Data Is Stored Currently
FIGURE 9
SEAGATE POV
Source: The Seagate Rethink Data Survey, IDC, 2020

RETHINK DATA: PUT MORE OF YOUR BUSINESS DATA TO WORK—FROM EDGE TO CLOUD | 25 |
When asked what was the most
important factor driving the changes
being made to the organization’s
approach to how it manages central
storage needs:
• 17% of respondents pointed to
improving data security
• 14% quoted increasing access
for data analytic and management
services (AI/ML, IoT, etc.)
• 14% noted increasing visibility
and manageability of IT
infrastructure operations
• 11% listed reducing cost/TCO of
infrastructure
• 10% mentioned providing faster
access to data for applications
and business units
Third-party managed
enterprise data centers
Internally managed
enterprise data centers
2020
2022
Edge data centers
or remote locations where data is stored
Cloud repositories
(public, private, industry)
Other locations
2022
2020
2022
2020
2022
2020
2022
2020
2022
2020
9%
8%
22%
25%
19%
19%
30%
28%
20%
20%
Where Data Is Stored Now vs. Two Years From Now
FIGURE 10
Driving Changes in
Data Management
Improving data security
17%
14%
14%
11%
10%
9%
9%
8%
8%
Increasing access for data analytic and
management services (AI/ML, IoT, etc.)
Increasing visibility and manageability of
IT infrastructure operations
Reducing cost/TCO of infrastructure
Providing faster access to data for
applications and business units
Meeting increases in data
capacity requirements
Improving ease of use
Improving availability and
increasing uptime
Integrating third-party services to use
alongside modern infrastructure
Driving Factors in How Data Is Stored
FIGURE 11
Source: The Seagate Rethink Data Survey, IDC, 2020
Source: The Seagate Rethink Data Survey, IDC, 2020

RETHINK DATA: PUT MORE OF YOUR BUSINESS DATA TO WORK—FROM EDGE TO CLOUD | 26 |
Before business owners
implement the steps to better
manage data, they need to
understand their own data.
Unfortunately, most organizations
have a tendency to collect and
dump data into large repositories.
But when they merely collect
tons of data, they will struggle
to make sense of it. If they don’t
understand their company’s data,
then they don’t know what data
they need to collect and what
intelligence they can get out of it.
Business leaders’ rst task is to
dene why they want to collect data
and what insights they are trying to
gain. Only once they are clear on
that agenda should they go after
that particular goal—as opposed to
the kitchen sink approach.
Collecting data is easy.
Intelligence is hard.
To smartly collect and sort through
data, enterprises need to deal with
challenges of overlapping tools, data
complexity, data integration, ensuring
that data is “clean,” ensuring proper
data correlation, etc.
Collecting data has to be about
what enables the business objective
(what business owners want to
learn). Unless they gure this out,
amassing data won’t provide them
with the value they expect.
Take, for example, manufacturing.
Many industries adopted large
volumes of IoT devices and
platforms, endpoint devices with
sensors, as well as ML and AI
to manage their manufacturing
ecosystems. Data collection
happens at unprecedented
volumes. Business owners can
collect a great deal of data. But
without understanding what they
want out of their data, it can be
difcult to accomplish basic goals—
for example, to improve throughput
of manufacturings—if the factories
are ooded with tens of thousands
of uncoordinated IoT devices
deployed on different platforms.
Business Owners, Stop (Merely) Hoarding Data
Another way to achieve successful
data management is through
smart data storage solutions.
Challenges arise as a result of a
conuence of factors:
• Nonstandard architectures
• The proliferation and
coexistence of different storage
technologies
• Difculties managing the storage
technology footprint
• Lack of visibility, or the so-called
single pane of glass, of stored
data’s management (object and
le storage show up differently)
• Deciding which data goes where
• Prohibitive costs play a role in
decision-making about storage
solutions
• Inability to look at a multicloud
storage pool as a whole
between on-prem and cloud
A key solution to these data
storage management challenges
has to do with how business
owners see the stored data. The
idea is to see it—all of it—as if
through a single pane of glass. It
goes beyond data democratization
and into storage unication. CIOs
should be able to look across the
multiple cloud ecosystems in a
seamless manner.
Data Storage, Through a Single Pane of Glass
SEAGATE POV
RETHINK DATA: PUT MORE OF YOUR BUSINESS DATA TO WORK—FROM EDGE TO CLOUD | 27 |
This challenge, meaningfully
shown by the shift of data to the
multicloud ecosystem, can be
solved by storing data in clouds
that allow enterprises control
over their data (on premises,
private clouds, or the rare public
clouds that do not come with
data lock-in).
Another solution on the horizon
is storage virtualization, which a
number of companies are working
to innovate. In this scenario,
the single pane of glass would
be a data storage management
software layer.
Bottom line for business owners:
ownership of your data starts with
an unobstructed, easy view into it—
as if through a single pane of glass.
Data Management
Challenges
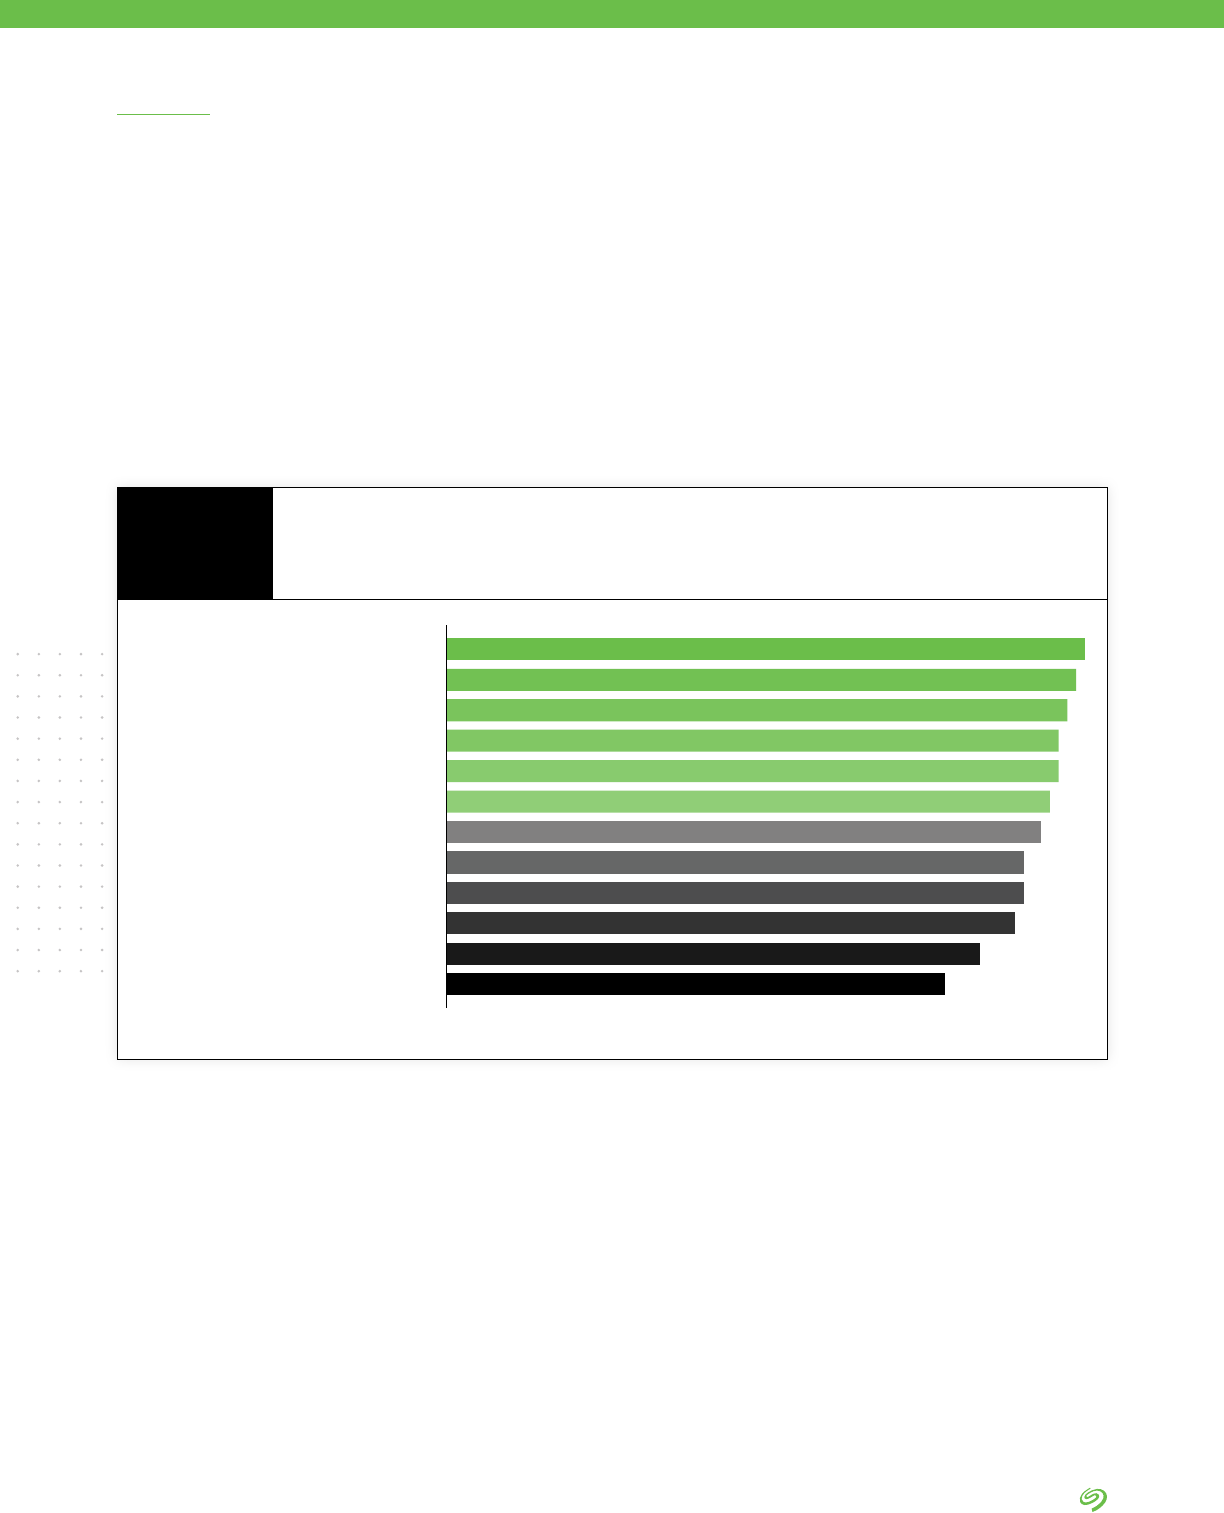
Organizations face ve key
challenges that they believe limit
their ability to exploit the full
potential of collected data:
1. Making collected data usable
2. Managing the storage of
collected data
3. Ensuring that needed data is
collected
4. Ensuring the security of
collected data
5. Making the different silos of
collected data available
DATA BY IDC
These considerations are put
in the language of IT. But they
should matter to business owners
because they directly affect the
value of data that businesses can
uncover, which affects revenue (as
we’ll see in chapter 6.) Modern
data management solutions
should focus on resolving these
challenges to provide the most
effective experience possible
for both business owners and
customers, and begin to help
businesses chip away at the
percentage of data that they are
unable to exploit.
In the following chapter we learn
about the one reported missing
link of data management that can
help make this happen.
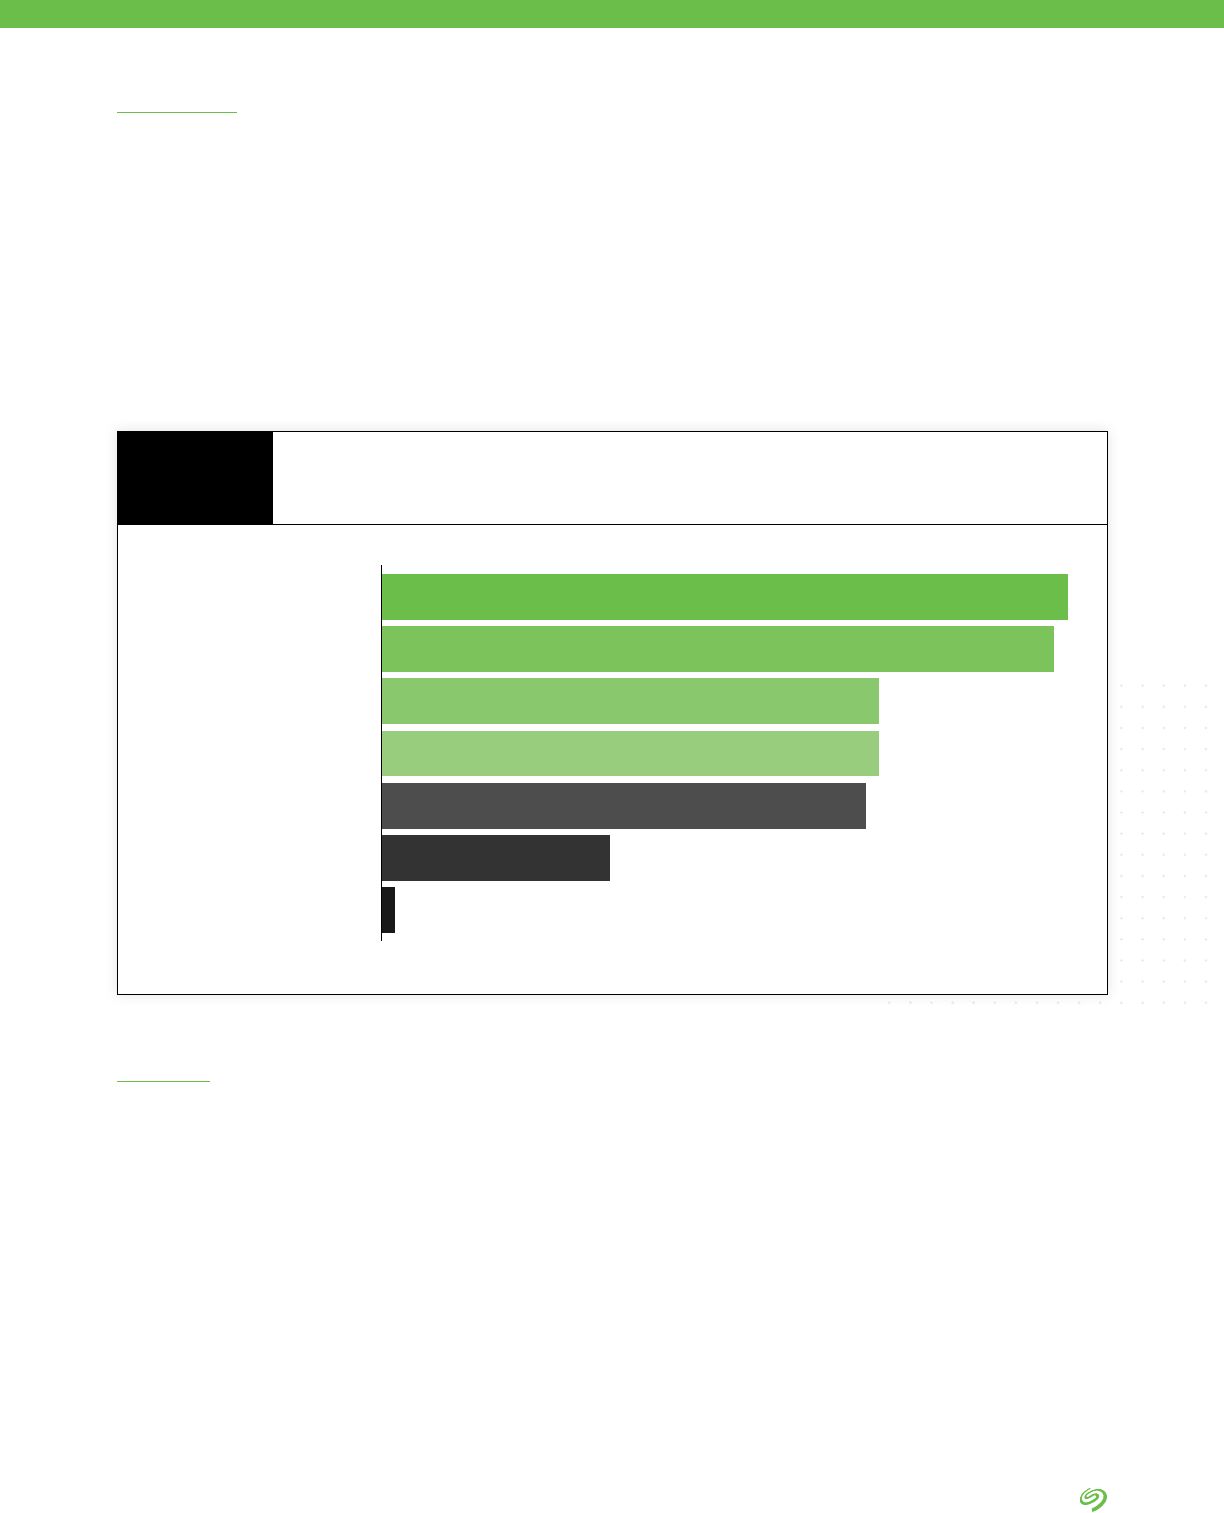
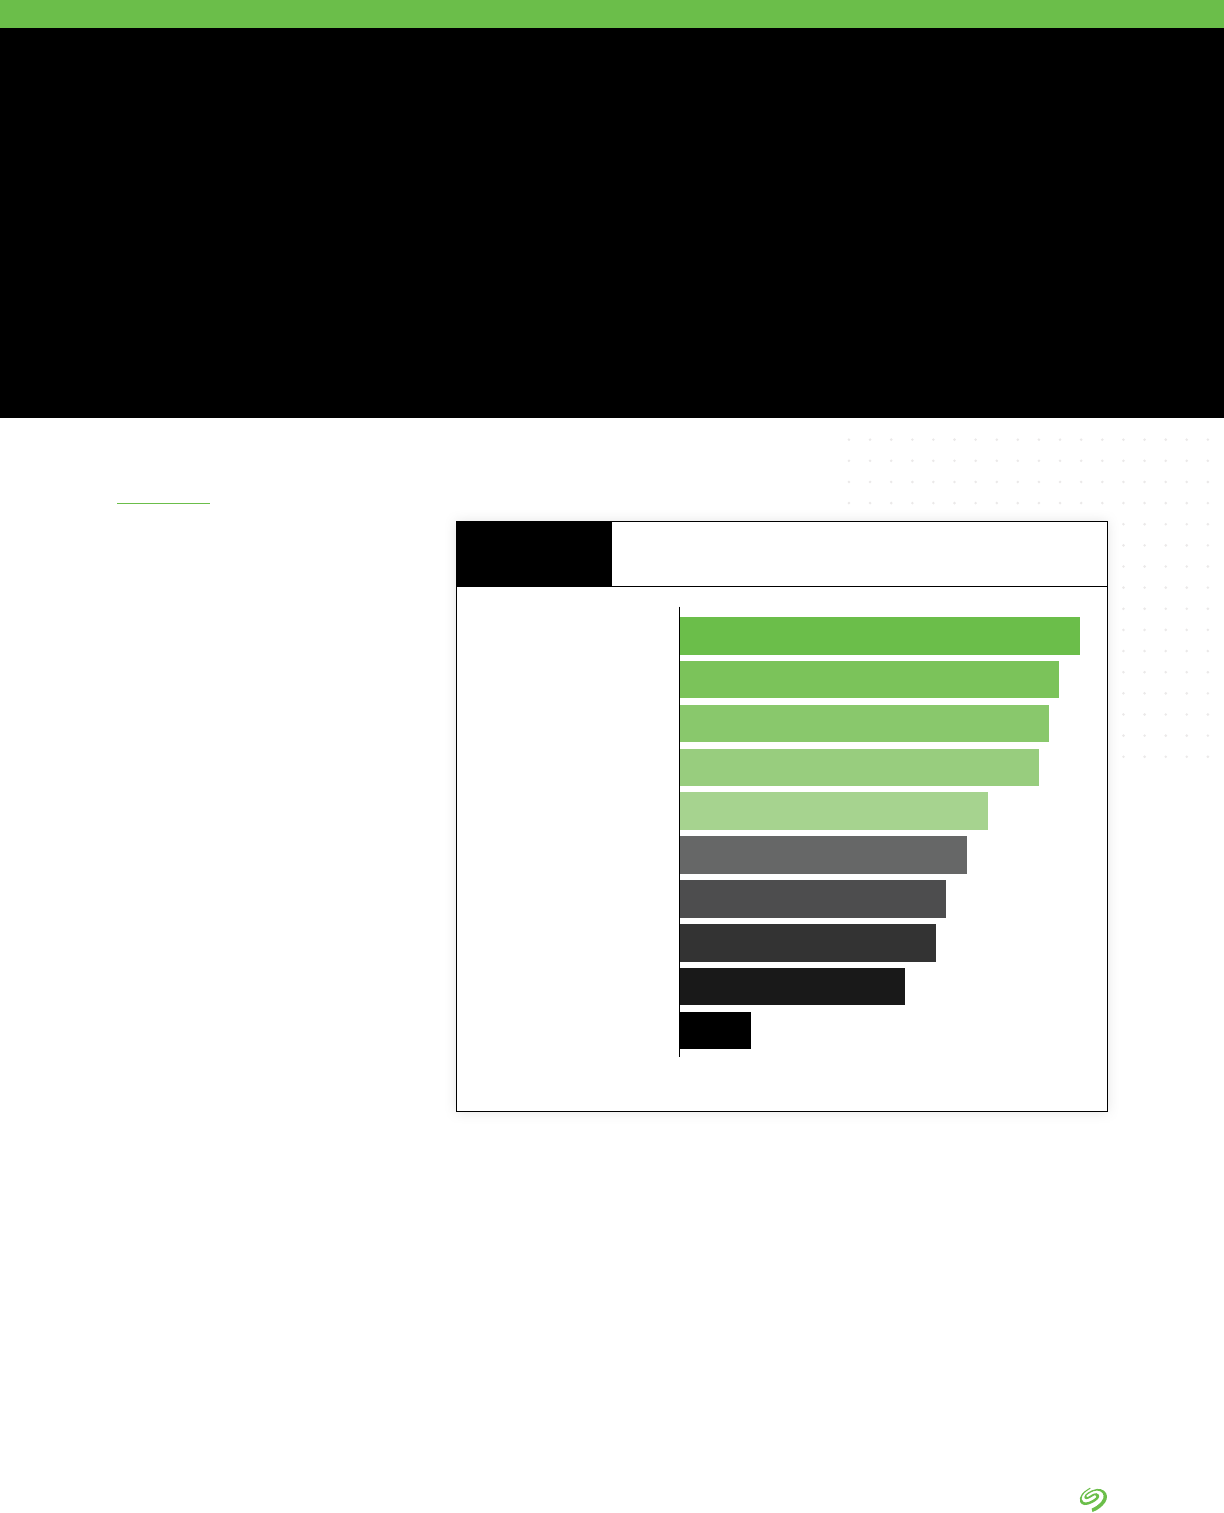
Making collected data usable
39%
37%
36%
35%
30%
28%
26%
25%
22%
7%
Managing the storage
of collected data
Ensuring that needed
data is collected
Ensuring the security
of collected data
Making the different silos of
collected data available
Getting the required resources
to manage collected data
Having the technology in
place to analyze data
Establishing data management
governance and processes
Building the people resources
needed to analyze data
Connecting the curated
data with data users
Barriers to Putting Data to Work
FIGURE 12
Source: The Seagate Rethink Data Survey, IDC, 2020

RETHINK DATA: PUT MORE OF YOUR BUSINESS DATA TO WORK—FROM EDGE TO CLOUD | 28 |
In our survey data, the
manufacturing industry has
distinguished itself as a data
management laggard of sorts.
Perhaps counterintuitively, the
sector shows the lowest level
of task automation in data
management, and lowest rate for
full integration (single platform) of
data management functions.
• Manufacturing lags in both
multicloud and hybrid cloud
adoptions.
• Along with the telco and CDN/
media industries, it indicates
below-average satisfaction with
its data management approach.
• Along with telco, respondents
in manufacturing indicate
low satisfaction with data
management tools.
• Manufacturing’s greatest data
management challenge is storage
management.
Additionally, manufacturing
indicated one of the lowest rates
of data growth of any industry
(37% vs 42.2% on average).
However, the sector has the highest
enterprise data center footprint (on
premises) of any surveyed industry.
This may provide insight into why
manufacturing has a lower rate of
data growth: they are slowed down
by on-premises infrastructure that
is likely more difcult to expand
in terms of capacity (especially
when compared to scalable cloud
infrastructure).
An argument can also be made
that while manufacturing generates
a signicant amount of sensor and
device-related data, much of it is
produced at the edge and discarded,
rather than transferred to a core
environment for long-term storage.
Manufacturing also indicated the
lowest levels of automation of data
management functions—and the
lowest rate for full integration of data
management functions on a single
platform (just 9%, compared to 19%+
in all other industries). Both of these
data points may be driven by the
sheer number of connected assets
entering modern manufacturers.
As IDC’s Manufacturing Insights
2018 IT and OT Integration
Survey showed, nearly 80% of
instrumented production assets
are digitally connected in some
form. The question is why does
this disconnect between digital
assets and data management
exist within the manufacturing
industry? IDC research has identied
two important challenges to consider
alongside this survey analysis:
1. Manufacturing faces a major skills
gap. If skilled people represent
the ultimate opportunity for the
factory of the future in developed
economies, the lack of adequate
skills is one of the toughest
barriers that companies need to
address. They are dealing with
aging workforces and challenges in
nding new skilled employees willing
to work on the plant oor when it
comes to hard and soft IT skills.
2. Most manufacturing plants are
lucky if they can connect to half
of their assets on the oor. This
isn’t just about applications, data
centers, and networks; it’s also
about core enterprise architecture
and infrastructure decisions
such as IT/OT integration and
security. In many cases, legacy
infrastructure simply won’t be
able to keep up with the amount
of connected assets entering the
plant. As a result, many plants
may implement ad hoc processes
to connect and manage assets
without being able to rely on
underlying infrastructure for
comprehensive management.
Manufacturing: An Outlier
ANALYSIS BY IDC
RETHINK DATA: PUT MORE OF YOUR BUSINESS DATA TO WORK—FROM EDGE TO CLOUD | 29 |
CHAPTER FIVE
In the age when the volume of data
is proliferating at unprecedented
speed, how do enterprises
manage all this data in a way that
taps its value and satises both
shareholders and customers?
The survey identied a key solution
to this data management quandary:
DataOps. Throughout the global
business landscape, DataOps
looms as the missing link of data
management—and the solution to
business owners’ data headaches.
DataOps, dened by IDC as the
discipline connecting data
creators with data consumers,
should be part of every successful
data management strategy.
DataOps is part of data
management. In addition to
DataOps, data management
includes data orchestration
from endpoints to core, data
architecture, and data security.
The goal of data management is
to facilitate a holistic view of data
and enable users to access and
derive optimal value from it—both
data in motion and at rest.
Given what we’ve learned in the preceding
sections, a conundrum emerges.
DataOps: The Missing Link
of Data Management
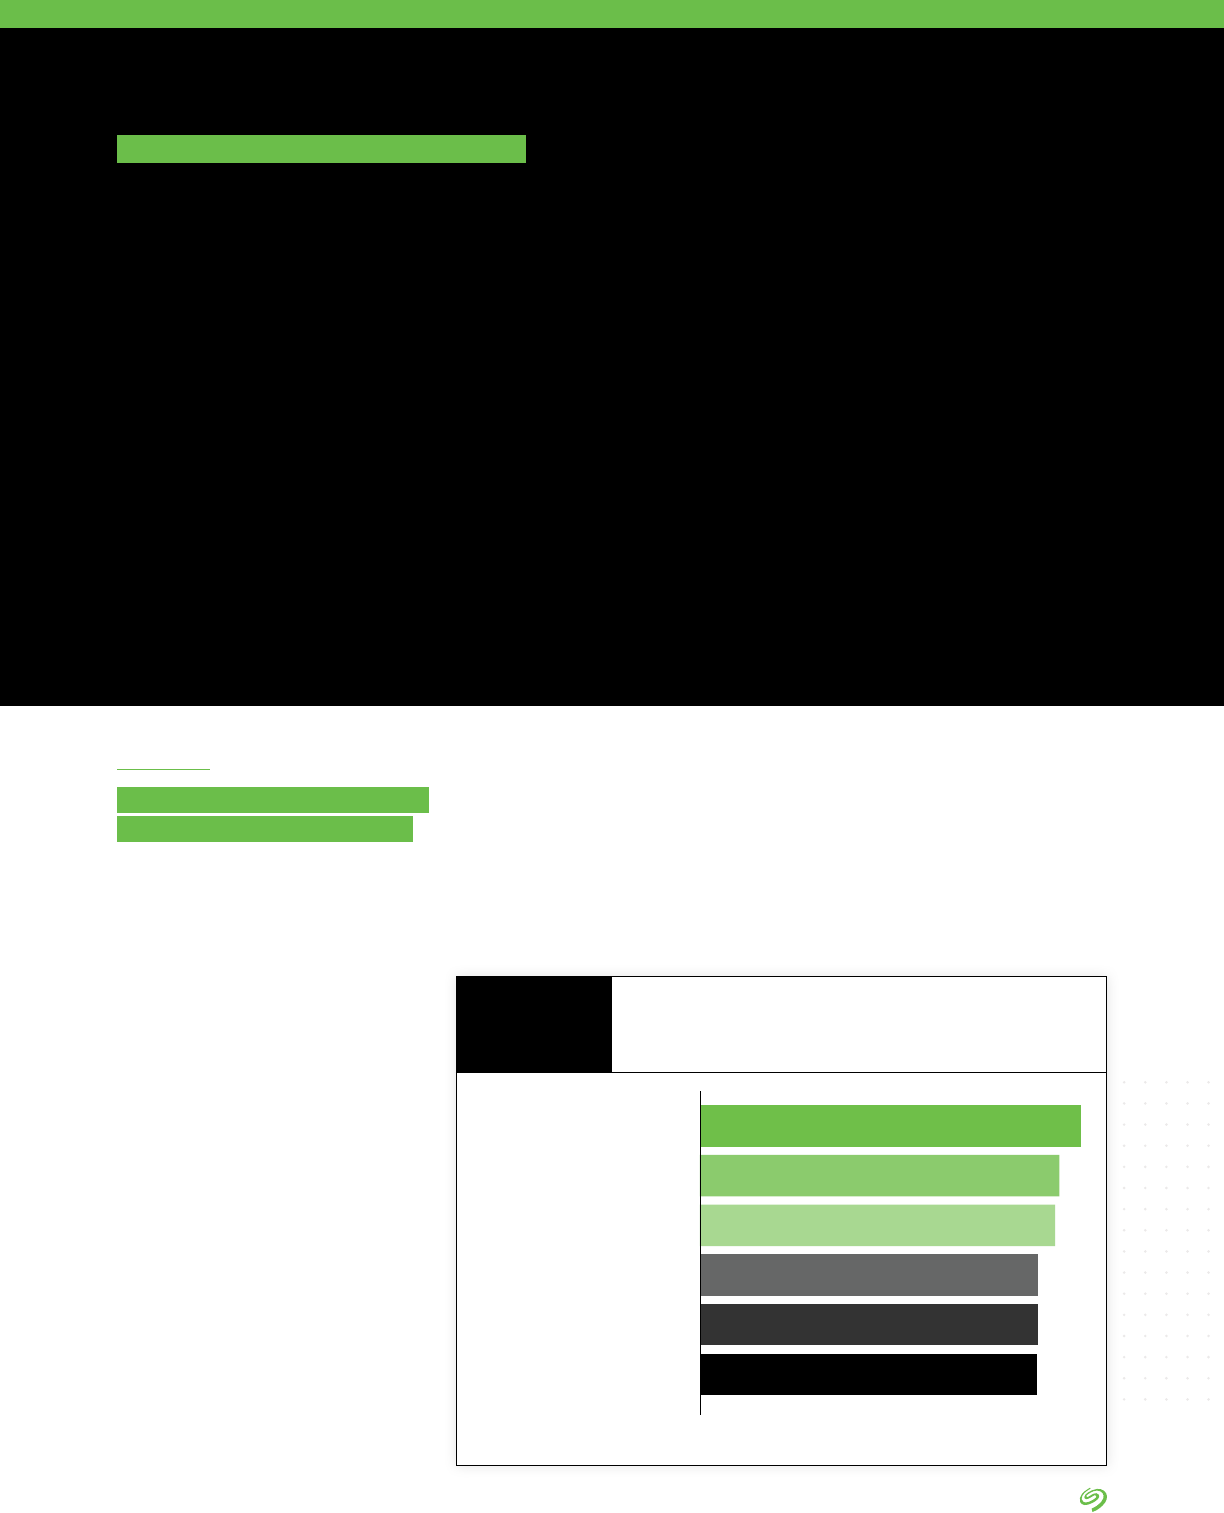
DataOps
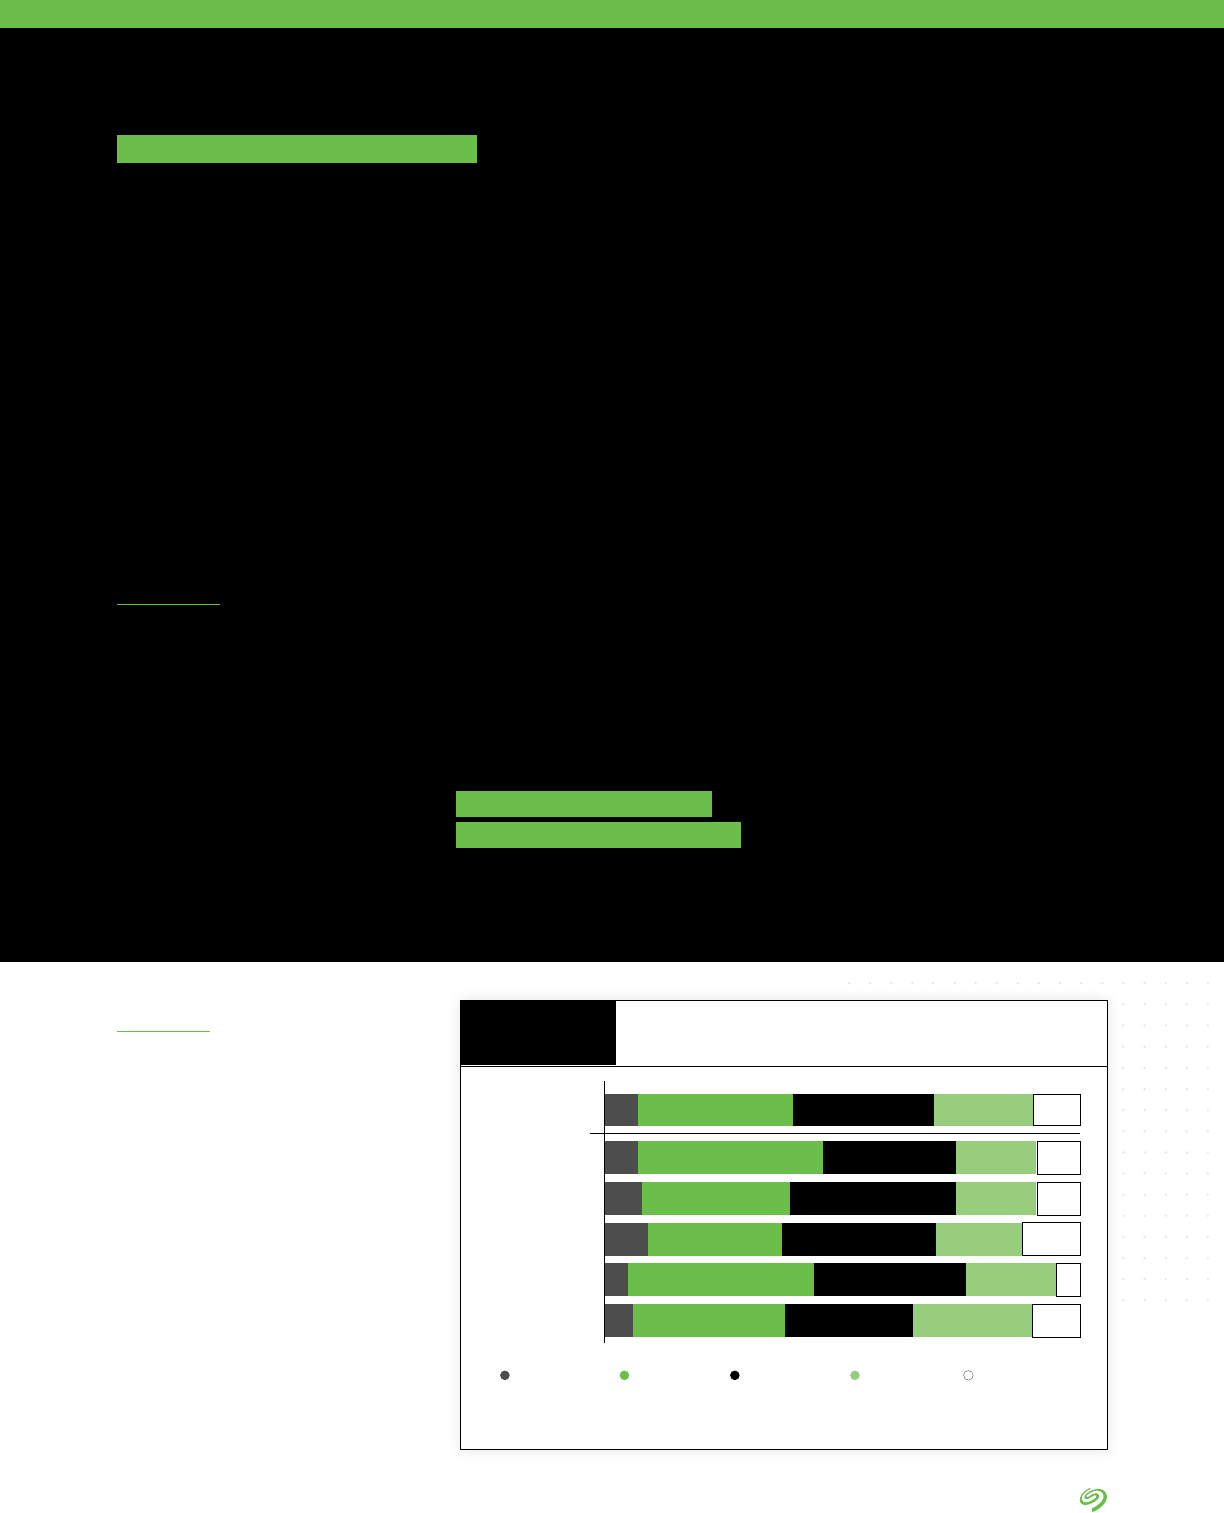
Across regions and industries,
only an average of 10% of
organizations report having
implemented DataOps fully across
the organization. The opportunity
is there for the taking.
DataOps is neither a technology
nor a process, but rather an
emerging discipline of connecting
data consumers with data creators
to enable collaboration and
accelerate innovation.
DataOps capacity
has been fully implemented
across the organization
DataOps capacity
has been partially
implemented
Have started to build
DataOps capacity
Considered and
planning to build
DataOps capacity
Not considered this
separately at all
Tota l
33% 30%7% 21% 10%
Transportation/EV 39% 28%7% 17% 9%
Telecommunications
31% 35%8% 17% 9%
Media
28% 32%9% 18% 12%
Manufacturing
39% 32%5% 19% 5%
Other
32% 27%6% 25% 10%
The State of DataOps
FIGURE 13
DATA BY IDC
SEAGATE POV
Source: The Seagate Rethink Data Survey, IDC, 2020
RETHINK DATA: PUT MORE OF YOUR BUSINESS DATA TO WORK—FROM EDGE TO CLOUD | 30 |
Data consumers are people
within business units who
are responsible for driving
the organizational decision-
making—whether toward product
development, product distribution
and marketing, cost control,
operations, etc. Common data
consumers are general managers,
VPs, CXOs, and the people who
support them. Data consumers
really don’t need data; instead,
they need actionable information.
Data creators can be both
machines—such as endpoint
and IoT devices—and people
who generate the reports and
information that is fed to decision-
makers. The challenge for data
creators is often to determine
what data must be collected for
prompt activation and what should
be collected for retention. For
example, the health of a device
(e.g., whether it’s running) may
not necessarily require immediate
processing and can be moved to
long-term archiving. However, data
about the device’s operations (e.g.,
temperature, capacity, speed, etc.)
may need immediate analysis or
coordination. This sort of data can
lead to better predictive analytics,
event correlations, and so on.
DataOps can exploit technology,
in particular AI and ML, to assist
in correlating data from core,
cloud, and edge data sources.
DataOps also utilizes ELT-like data
ingest functionality (Extract. Load.
Transform.) to pull data from multiple
sources and load into a common
structure, frequently as a data lake.
AI can be a key for transforming
data into the information needed by
decision makers.
Being able to correlate data from
disparate sources is a capability
not easily available through other
means. Because it is difcult,
those organizations able to master
it can expect to have an edge over
the competition.
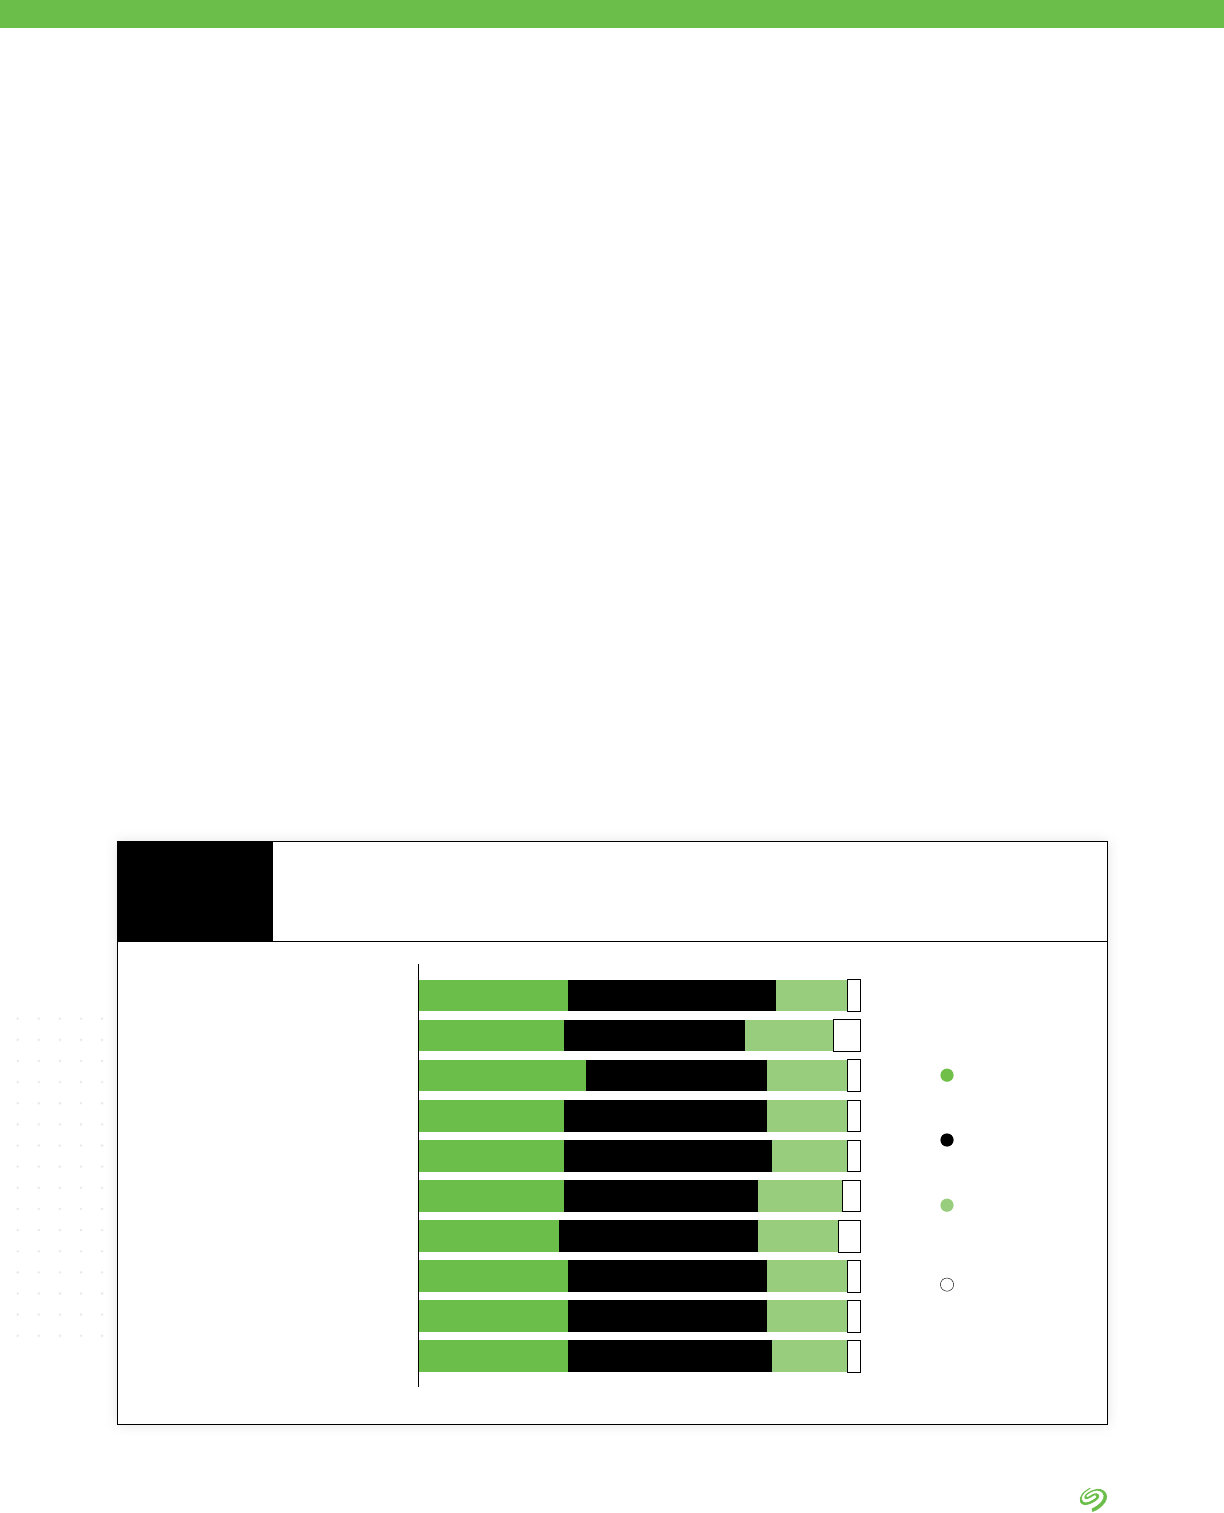
The survey revealed that most
organizations have multiple tools
to perform a similar function,
which makes enterprise data
management a challenge.
In fact, only about one third of
organizations reported having
a single solution for a single
function. This may be caused
by a variety of reasons: different
buyers within the organization,
incompatibility of solutions across
platforms, or simply historical
evolution of the systems.
Back up/Recover
Container orchestration
Policy management
Data discover
Data classication
Metadata management
Recovery orchestration
Data security for data being stored
Data security for data on the move
Data migration, tiering, or placement
34% 47% 16% 3%
33% 41% 20% 6%
38% 41% 18% 3%
33% 46% 19% 3%
33% 47% 17% 3%
33% 44% 19% 4%
32% 45% 18% 5%
34% 45% 18% 3%
34% 45% 18% 3%
34% 46% 17% 3%
Not sure
Apps deployed in
some locations
or for some
applications
Multiple apps
deployed enterprise-
wide in all locations
Single app deployed
enterprise-wide
in all locations
Approach Used to Deploy Tools or Applications for
Data Management Functions
FIGURE 14
Source: The Seagate Rethink Data Survey, IDC, 2020

RETHINK DATA: PUT MORE OF YOUR BUSINESS DATA TO WORK—FROM EDGE TO CLOUD | 31 |
While it may be necessary to have
point products at a system level,
it is essential to have a unied
data management capability.
DataOps is the practice of bringing
disparate data systems into an
understandable entity. The core
functionality needed for DataOps
is metadata management,
data classication and policy
management. As data is ingested,
the metadata management function
allows data to be associated
and managed based on its
characteristics. This metadata,
along with data classication
capabilities, can identify specic
types of data, such as personally
identiable information (PII) and data
governed by the Health Insurance
and Portability and Accountability
Act (HIPAA). Once data is classied,
AI algorithms can be developed to
automatically recognize data and
make associations.
DataOps is particularly well suited
to the iterative learning approach
required by AI-driven applications.
This approach is the reverse
of the traditional data analytics
approach. Traditional analytics
takes a problem and searches
for an answer; DataOps makes
data associations and searches
for insights. For example, data
may reveal that consumers make
seemingly unrelated product
purchases together, leading to
better merchandizing or product
placement; or it may spot trends
within certain demographic groups
leading to focused micromarketing.
It is not always technology only
that stands in the way of effective
DataOps. Business owners need
to be aware of culture and people
challenges.
When organizations operate
in silos, too often different
competing groups work toward
their own objectives. They want
to gain and keep control of data.
The mindset is, if they lose control
of the data, they lose power,
because data is power.
As a result, data is stored,
managed, and analyzed in silos.
If various groups within an
organization access the same raw
company data and each group
does analysis, their reports do
not often match because they
don’t avail themselves of a global
repository of data.
The solution to this people problem
needs to start with the business
owner’s strategy. That strategy
needs to institute global standards,
global data architecture, global
data management, and the same
access to the same analytical tools
by global teams.
Rolling back reporting functions
to IT can provide global tools,
capabilities, and solutions
that every group can leverage.
The various groups within the
enterprise should get out of siloed
management of their own data,
and allow the IT-instituted tools to
do that globally.
In doing so, the teams will be
freed to make decisions based
on insights from reliable, global,
accessible pools of data.
DataOps: The Human Element
SEAGATE POV
RETHINK DATA: PUT MORE OF YOUR BUSINESS DATA TO WORK—FROM EDGE TO CLOUD | 32 |
• Majority of respondents say
that DataOps is “very” or
“extremely” important
• DataOps is seen as most
important in North America and
China (see Section II for the
regional analysis)
• While DataOps is considered
important across all industries,
transportation shows a slightly
higher need for it than other
industries
• While this survey was done
prior to the COVID-19
pandemic, DataOps is going
to be even more needed as
more people continue to rely on
working from home, which has
already accelerated migration to
cloud services.
Business leaders all over the globe agree with the need for DataOps.
Not very
important
Somewhat
important
ImportantVery
important
Extremely
important
Total
NA
China
Europe
APJ
42% 24%23% 10% 1%
40% 17%34% 9% 1%
0%
52% 15%29%
44% 28%15% 11% 3%
37% 29%21% 12% 1%
3%
Importance of DataOps
FIGURE 15
Source: The Seagate Rethink Data Survey, IDC, 2020

RETHINK DATA: PUT MORE OF YOUR BUSINESS DATA TO WORK—FROM EDGE TO CLOUD | 33 |
CHAPTER SIX
The ndings make clear that in
large part the solution to data
management puzzles can be
found in implementing DataOps—
the discipline that connects data
consumers with data creators,
and the processes that go with
it. How do we know DataOps is
useful? The survey results point
to a signicant result.
Along with other data
management solutions—
analytics-enabled data
orchestration and well-functioning
data architecture—DataOps
leads to measurably better
business outcomes. Among them:
improved customer loyalty and
satisfaction, better prots, higher
revenues, and greater employee
retention and productivity.
DataOps therefore has a
demonstrated bearing on an
enterprise’s competitive edge.
At last, we come to the truly good news that the
survey delivers to business owners.
Better Business Outcomes
SEAGATE POV
RETHINK DATA: PUT MORE OF YOUR BUSINESS DATA TO WORK—FROM EDGE TO CLOUD | 34 |
A Competitive Edge
Efcient DataOps is the foundation
for rapidly building and training AI
models and for deploying analytics
at scale. These advanced
analytical results can lead to
competitive advantage.
The survey found that better data
analysis leads to measurably better
business outcomes.
The following chart points out
the areas of improvement from
organizations that cited having
improved data analytics. Note that
speed of improvement makes a
difference, since most organizations
can say they improved over time.
The companies that improve fastest
can expect better business results
compared to peers. Though the
results in Figure 16 do not reect the
effect of DataOps alone, DataOps is
the latest and leading-edge method
for improving data management.
For most organizations, the trifecta
of better business outcomes is the
following:
1. Better revenue.
2. Better prot.
3. Better customer satisfaction/loyalty.
But better results due to data
management and analytics were
seen across the enterprise and
also included:
• Better employee productivity.
• Better employee retention.
• Lower costs.
• Improved regulatory compliance.
• Better new customer acquisition.
Among the more proactive
results is better new customer
acquisition, which obviously is the
key to growing revenue.
DATA BY IDC
Employee productivity
Revenue
Prot
Customer satisfaction/loyalty
Customer retention
Employee retention
Adherence to regulatory compliance requirement
Operational costs
Shorter time to market for new products and services
New customer acquisition
Number of new products and services offerings
Reduction in CapEx requirements
73%
72%
71%
70%
70%
69%
68%
66%
66%
65%
61%
57%
Indicators Used to Measure the Success of Investments in
Data Management and Analytics in Improving Performance
of the Organization
FIGURE 16
Source: The Seagate Rethink Data Survey, IDC, 2020

RETHINK DATA: PUT MORE OF YOUR BUSINESS DATA TO WORK—FROM EDGE TO CLOUD | 35 |
DataOps: Getting to Customer Satisfaction and Prot Through Data
This survey established that a
smooth-functioning DataOps is key
to data management that enables
organizations to get more value
out of data and boosts business
outcomes such as prot and
customer satisfaction.
How can businesses get there?
As noted in the preceding section,
the human element of the equation
cannot be overstated. It’s the
people who keep data in silos.
Consequently, the way to institute
effective DataOps is not just about
having the right tools. To be sure,
the right tools are key. Virtualization
tools are immensely useful, if not
necessary, in that they allow for the
retrieval and manipulation of data.
Whether it’s a software virtualization
plane (such as Kubernetes, “a
portable, extensible, open-source
platform for managing containerized
workloads and services, that
facilitates both declarative
conguration and automation”)
or virtual machines that are an
abstraction mechanism for app
deployment, virtualization layers can
streamline data management.
But before DataOps avails itself
of virtualization, it has to start with
decisions about data. Putting tools to
work is the easy part. It’s trickier for
enterprise leaders to make decisions
about data via data governance and
processes around it.
Business owners need to start
with their goals—which commonly
include boosting customer
satisfaction and prot. To get
there, they need to interrogate
the data at their disposal.
They need to coordinate data
from various sources and solve
governance issues such as:
• Who has access to what data?
• How to classify data?
• Which data to keep and where?
• What to do with data after it’s
analyzed?
• How to make data available?
• How to interconnect data?
In order to make these
determinations, business owners,
data administrators, or CIOs
need to consult subject matter
experts (SMEs). Along with
SMEs, they need to identify,
evaluate, cleanse (detect and
correct inaccurate records),
and validate data. SMEs need
to be at the table because only
they possess deep knowledge of
certain types of data.
It’s with the involvement of the
SMEs, under the direction of
business owners, and facilitated
by data administrators that
determinations need to be made
regarding a key question: What
intelligence do you want out of
what data? What do you want it to
tell you? How do you want to use it?
There can be about 10,000 entry
point parameters collected for a
single product that a company
manufactures. If the company is to
retain all these points of information
for just one product, without a
clear data architecture dening
where it will all be stored and how
it will ow between environments,
the data risks drowning in a data
swamp. The decision-makers
need to confer with product design
engineers and quality engineers,
and ask: Which of the 10,000
parameters are the most critical?
Then, through interrogating and
tracking the curated data, they are
on a more efcient path to building
components and solutions.
The upfront work of data
governance—involving
coordination, discussion, analysis,
agreements around language,
and data classication (more on
this in the following chapter)—can
give way to the mostly-automated
downstream processes facilitated
by virtualization tools.
This twofold process of DataOps
can then reap the results of
customer satisfaction because
optimizing the governance and
ow of data leads to better quality
of offerings, which directly affects
how customers feel about their
purchases. As IDC analysts pointed
out in the previous chapter, speed
of delivery matters too. Getting
to results faster means greater
customer satisfaction—because
getting to data faster means
customers and business owners
can make decisions faster.
This is how a process that starts
with business owners setting out
to increase customer satisfaction
and prot attains these very goals
through optimizing data via DataOps.
It’s about being intentional on
making the most of data.
SEAGATE POV
RETHINK DATA: PUT MORE OF YOUR BUSINESS DATA TO WORK—FROM EDGE TO CLOUD | 36 |
CHAPTER SEVEN
In addition to DataOps, a unique part of data
management that deserves a special examination
is data security.
Data Security and Data
Management
Two thirds of survey respondents
report insufcient data security,
making data security an essential
element of any discussion of
efcient data management.
Data security is consistently rated
among the highest concerns and
priorities of IT leaders and business
leaders alike. Data breaches lead
to direct nancial losses, signicant
regulatory nes, reputational
loss and embarrassment, lost
customers, and more. Malware
attacks can result in the theft of
corporate secrets, lost employee
productivity, unrecoverable data,
and, in the case of ransomware,
nancial loss and embarrassment.
However, many organizations
surveyed have not implemented
common data security practices
enterprise-wide (Figure 17).
The results in Figure 17 do
not represent an all-or-nothing
approach to enterprise security.
That is, a respondent might answer
“yes” to encryption of data at rest,
but “no” to all others, for example.
Thus, it is highly probable that
the vast majority of organizations
have at least some signicant
vulnerabilities in their environments.
DATA BY IDC
Encryption of data in ight
Physical security of
data storage facilities
Employee training for handling
sensitive information
Encryption of data at rest
Masking of data
Location and movement
restrictions on data
36%
34%
34%
32%
32%
32%
Percentage of Organizations Fully
Implementing Key Security Practices
FIGURE 17
Source: The Seagate Rethink Data Survey, IDC, 2020

RETHINK DATA: PUT MORE OF YOUR BUSINESS DATA TO WORK—FROM EDGE TO CLOUD | 37 |
The biggest myth about enterprise
data security is that the technology
is the hard part; it’s not.
The challenge is getting alignment
on classication of data by risk
and on how data should be stored
and protected. That, as in the case
of DataOps, is the human element.
Technology boils down to
business owners’ purchasing
decisions. You want to protect
data at rest? Buy self-encrypting
drives; problem solved.
Educating data users—those
within the company who
create, touch, analyze, and
move the data—is a different
matter. Business leaders should
remember that the more data
creators and consumers within
their company are educated, the
better for the business. Business
owners’ own education about
data security is key to success,
because it ensures their buy-in.
The education about data security
should be democratic. Protecting
data (and the education that
comes with it) ought to be built
into other stacks. It cannot merely
be the domain of CISOs, CIOs,
IT admins, security, and the legal
teams. Data owners, too, should
be at the table.
Bottom line: If you’re a business
leader, don’t wait for a data breach
or data loss to grasp the reality
that data security is foundational
to the value your business can get
out of data.
Data Security: A People Issue
1. Data Classication. A daunting task that requires a lot of cross-
organization communication, classifying data is imperative. Data
creators, owners, and users within the organization must align on data
classication standards, and map data types to those classications.
Without this step of dening and aligning, any data protection program
will fail. Keep it simple.
For example, at Seagate Technology, team members aligned
to broader standards. As a result, the team arrived at four data
classications: restricted, condential, internal, and public.
2. Data Flows. Business owners must understand where the company’s
data is owing—either by design/intent or against design/intent.
Determining what is right or valid is an important step of dening controls.
Understanding data ows will help identify the biggest areas of risk.
3. Access Control. Role-Based Access Control (RBAC) may be the
most basic form of access control, but it is rarely comprehensive.
The idea that only those who need access should have access is
easy to grasp, but the discipline to implement and maintain is harder.
The higher the sensitivity of the data (per data classication), the
stricter the implementation. Beyond RBAC, other controls that can be
considered include:
• Information Rights Management (IRM) controls at the le-level
encryption, using granular access controls (restricting functions
like print, edit, copy/paste per given asset)
• Other access mechanisms like browser-only access (no
download) and watermarking to avoid screenshots/capture
Key Steps of Data Protection
SEAGATE POV

RETHINK DATA: PUT MORE OF YOUR BUSINESS DATA TO WORK—FROM EDGE TO CLOUD | 38 |
A well-implemented data security program can seem intimidating. And
it’s a good idea to not let the perfect be the enemy of the good. What
if you’re an overwhelmed business owner who can’t quite do it all right
now, but wants to rst take at least the most necessary steps, and take
care of the less-urgent protections later?
Here are the must-haves of data security that protect against the
greatest risks:
1. Encrypt data in ight. At a minimum, only use secure protocols and
services—HTTPS over HTTP, SFTP over FTP, IPSec, or SSL VPN for
all remote access. This is not hard: Only leverage tools that use secure
communication, congure them correctly, make it the standard, and
enforce compliance.
2. Encrypt data at rest. Laptops and mobile devices are the biggest risk
to data. Your storage array or server is generally in access-controlled
data centers; there’s little risk of it being stolen from a car or falling
out of a pocket in a cab. Address the biggest risks rst. Leverage
enterprise-managed full-disk encryption for laptops. Enforce le-system
encryption for mobile devices in mobile device management policies.
3. Educate users. As this report notes throughout, users will either be
your strongest or weakest control. Business owners need to ensure all
employees are educated on best practices and risk. Stop. Think. Protect.
Basics of Data Security
SEAGATE POV

RETHINK DATA: PUT MORE OF YOUR BUSINESS DATA TO WORK—FROM EDGE TO CLOUD | 39 |
SECTION TWO
Regional
Findings

RETHINK DATA: PUT MORE OF YOUR BUSINESS DATA TO WORK—FROM EDGE TO CLOUD | 40 |
CHAPTER ONE
APJ respondents included those based in
Australia, Japan, India, South Korea, and Taiwan.
For the purposes of this survey, China is treated as
its own region and not included in this category.
Asia Pacic and Japan (APJ)
To take a region like APJ and
characterize it as an entity is
increasingly difcult. Technological
advancement is not evenly
distributed across this diverse
region. With that said, the survey
includes ve of the region’s most
technologically developed countries.
Even given this sample, it is fair
to conclude that the region’s
integration of data management
functions is still developing.
The following survey ndings
distinguish the region from the others:
• APJ trails North America (NA) and
Europe with 34% of organizations
reporting having a single
enterprise-wide application for
policy management (Figure 1).
• 87% of respondents say that
DataOps is either “extremely
DATA BY IDC
Back-up/recovery
China NA EuropeAPJ
33%
40%
36%
32%
China NA EuropeAPJ
29%
35%
39%
31%
China NA EuropeAPJ
34%
36%
45%
38%
China NA EuropeAPJ
30%
33%
38%
31%
China NA EuropeAPJ
27%
36% 36% 36%
China NA EuropeAPJ
30%
34%
36%
34%
China NA EuropeAPJ
29%
28%
35%
35%
China NA EuropeAPJ
28%
34%
38%
37%
China NA EuropeAPJ
28%
39%
38%
35%
China NA EuropeAPJ
30% 27%
41%
34%
Container orchestration Policy management Data discovery Data classication
Metadata management Recovery orchestration Data security for data
being stored
Data security for data
on the move
Data migration, tiering,
or placement
Proportion of Respondents Reporting Their Organizations
Have a Single Enterprise-Wide App for Policy Management
FIGURE 1
Source: The Seagate Rethink Data Survey, IDC, 2020
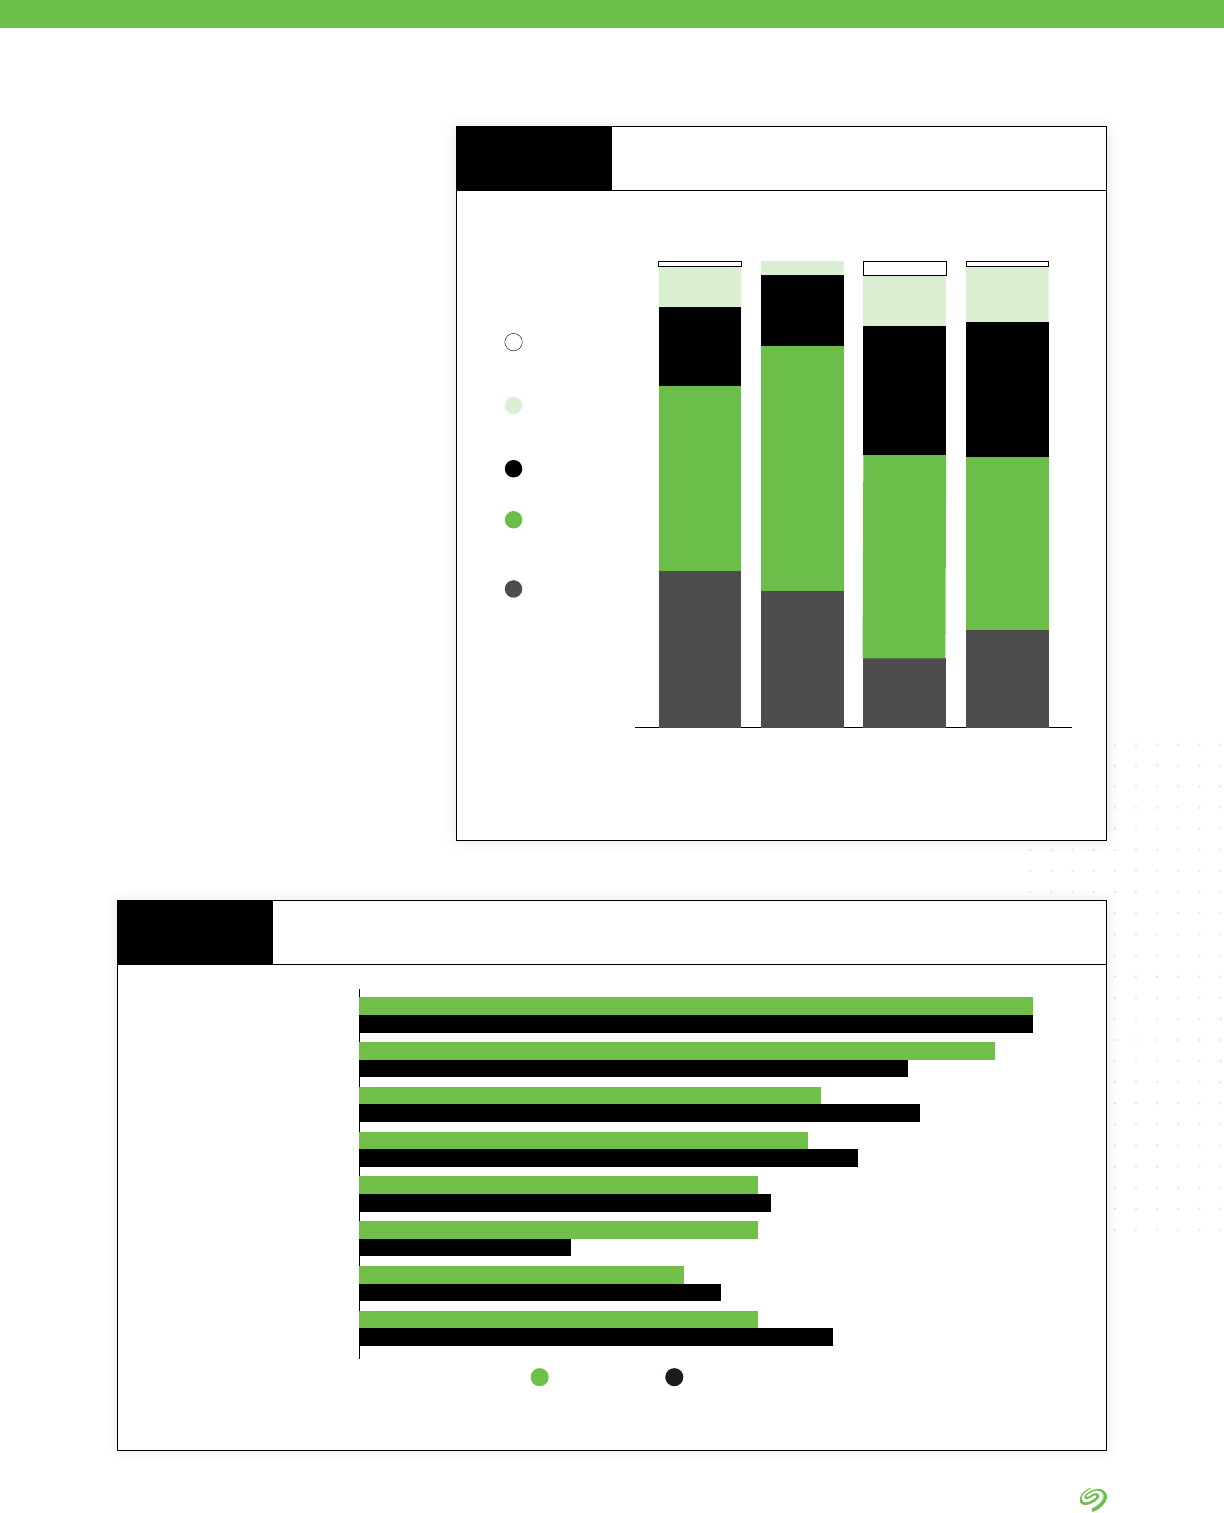
RETHINK DATA: PUT MORE OF YOUR BUSINESS DATA TO WORK—FROM EDGE TO CLOUD | 41 |
important,” “very important,” or
“important” (Figure 2).
• APJ sees the increase of data
growth in the next two years as
a result of more widespread use
of advanced data analytics and
the IoT devices to automatically
gather data. Unlike their
counterparts in other regions,
companies in APJ do not expect
as much of this growth to
happen as a result of the move
to the cloud (Figure 3).
• APJ organizations are least
daunted by the challenges to
managing data that they see in the
coming couple of years (Figure 4).
• APJ’s enterprise data does not
appear to be very dynamic. It
does not move as much as data
does in other regions. Still, within
the next two years, 7% of APJ’s
enterprise data is expected to
move to the cloud (Figure 5).
Not very
important
Somewhat
important
Important
Very
important
Extremely
important
NA China Europe APJ
40%
17%
34%
9%
1%
52%
15%
29%
44%
28%
15%
11%
3%0%
37%
29%
21%
12%
1%
3%
Increased use of advanced
data analytics
Increased use of IoT devices to
automatically gather data
Migrating on-premise
applications to the cloud
Increased use of SaaS
applications
Increase in edge application
development
Modernizing legacy applications
Increase in on-premise
app deployments
Changing operating systems
(OS) environments
ChinaAPJ
54%
54%
51%
44%
37%
45%
36%
40%
32%
38%
26%
29%
32%
32%
33%
17%
Importance of DataOps
FIGURE 2
Factors Impacting Data Growth
FIGURE 3
Source: The Seagate Rethink Data Survey, IDC, 2020
Source: The Seagate Rethink Data Survey, IDC, 2020

RETHINK DATA: PUT MORE OF YOUR BUSINESS DATA TO WORK—FROM EDGE TO CLOUD | 42 |
There are no region-wide laws or
regulations in APJ that impede the
movement of data across borders—
unlike, for example, Europe’s
General Data Protection Regulation
(GDPR). Data sovereignty is
less of an issue, or at least it is
treated differently. A unied policy
mechanism is the most efcient,
automated way to manage data
consistently at scale.
The fact that it is reported by
only a quarter of the respondents
means that most of the region’s
enterprises struggle with unifying
data management functions.
One potential factor impeding the
movement of data in APJ may
be the variety of languages and
laws that make the region very
heterogenous, with signicant
translation and compliance factors.
When looking at the proportion of
respondents indicating “extremely
challenging” or “challenging” to the
following data management issues
(Figure 4), APJ is consistently lower
than the overall survey average. Why
is it that APJ respondents appear less
pressured by the challenges related to
data management? Our hypothesis is
that data management maturity may
play a role here.
Compared to other regions, APJ
indicated the lowest average levels of
satisfaction with their organizations’
general approach to data
management. APJ also indicated the
lowest average levels of satisfaction
with data management tools. These
low levels of satisfaction with data
management operations and tools
may be indicative of earlier-stage
maturity of tools and processes in
the region. If APJ respondents are
not satised with their operations and
tools, it seems likely that there would
be a lower proportion of organizations
in the region pursuing advanced data
management tasks (e.g., managing
data in multi- and hybrid-cloud
environments). APJ organizations
may simply still be working to improve
the operational and technological
aspects of their data management
strategy, before moving on to more
advanced tasks.
With that said, APJ (tied with China)
leads the way when it comes to data
analytics and IoT being the top factor
propelling the growth of data (Figure
3). This could be because of the
growing use of devices by various
manufacturers, such as the OEM
suppliers in the region.
What It Means
ANALYSIS BY IDC
Although enterprise data
management is not as integrated in
APJ as in other regions, business
leaders should make sure it is agile
to better cope with future needs
such as a global pandemic where
the digital behavior completely shifts.
There is a need for an enterprise
data management to 1) encourage
business owners to classify data
properly and gure out what
goals it should accomplish; 2) put
analytics at the heart of decision-
making; and 3) prepare the
workforce for a data-driven future.
Room for Growth—and Education
SEAGATE POV
NA
57.5%
78%
China
54.8%
Europe
51.7%
APJ
Proportion of Regions Expecting
Extreme Challenges or Challenges in
Managing Data in the Next Two Years
FIGURE 4
Source: The Seagate Rethink Data Survey, IDC, 2020
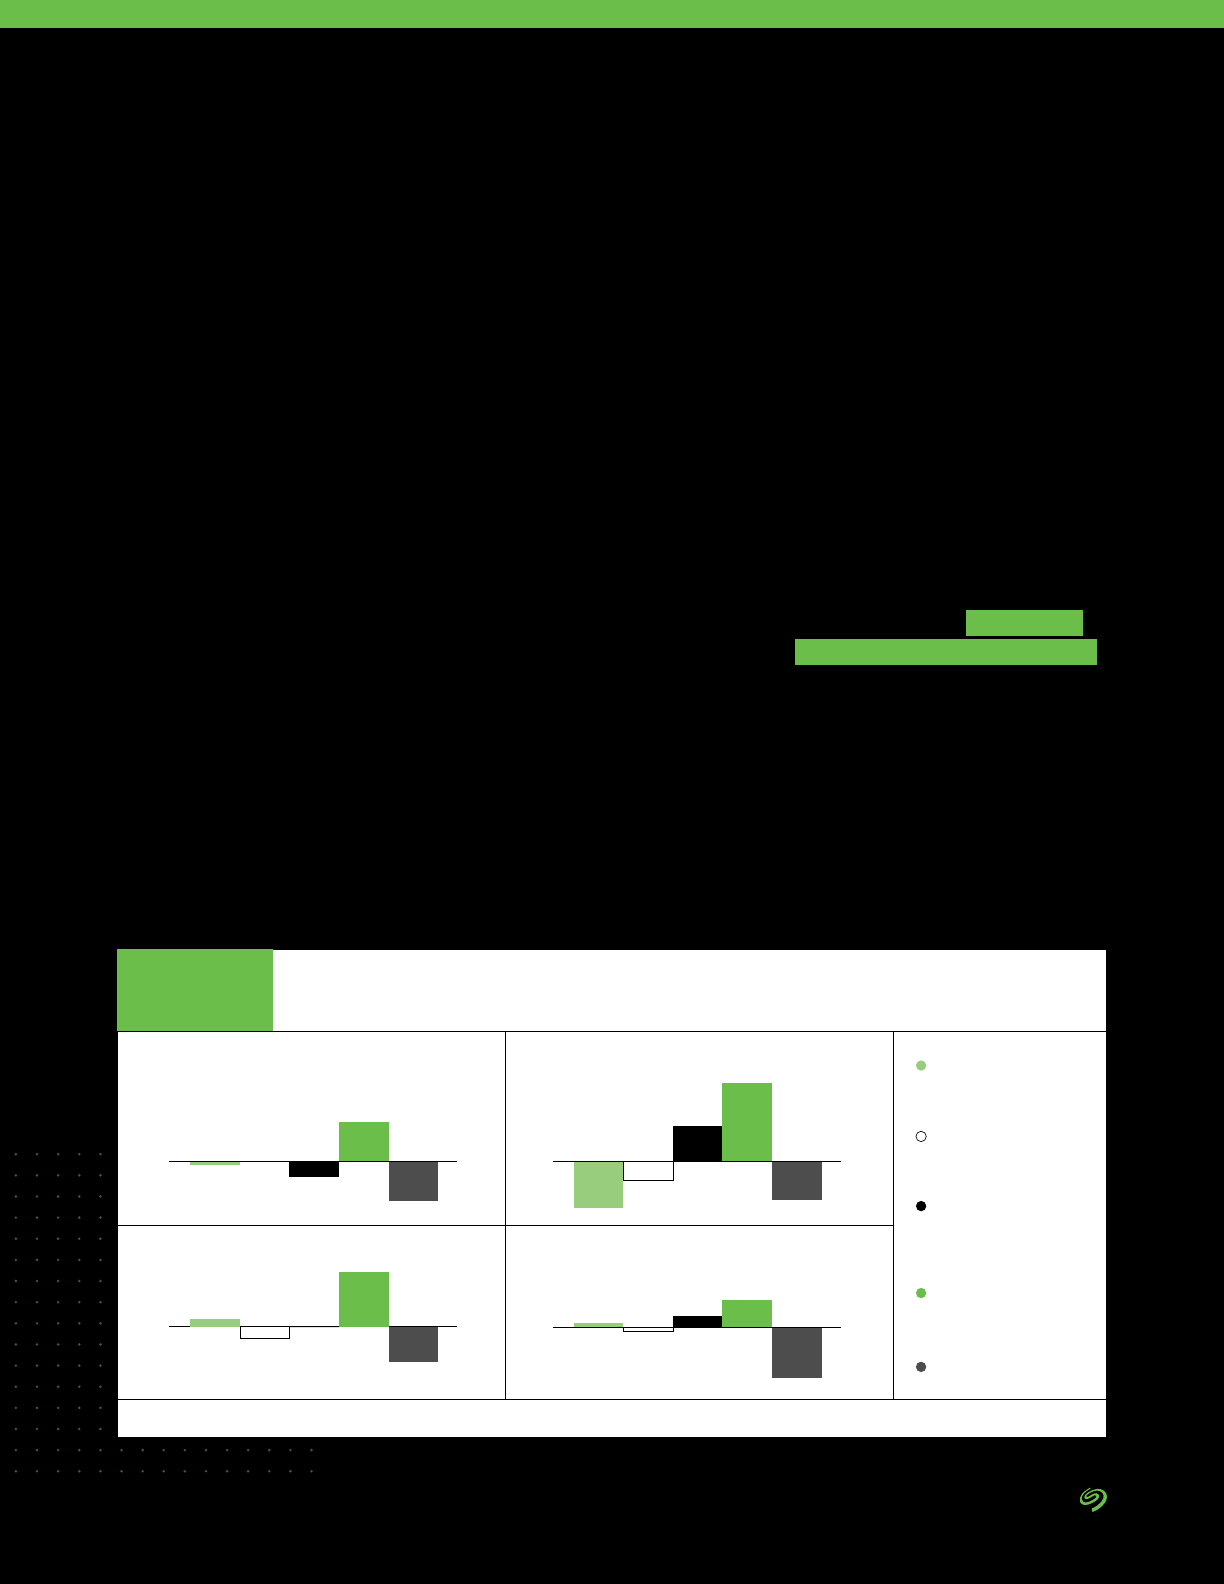
RETHINK DATA: PUT MORE OF YOUR BUSINESS DATA TO WORK—FROM EDGE TO CLOUD | 43 |
As IDC points out, a unied policy
mechanism is the most efcient and
automated way to manage data
consistently at scale. Why are both
a unied policy and DataOps not as
prioritized in APJ as in other regions?
First, except for privacy
protections, many APJ
governments historically have not
interfered with private companies’
management of their data.
Second, the companies in the
majority of the region’s countries
still need to raise their awareness
around optimizing the value of
data through company-wide data
policies. Business leaders need to
become familiar with the benets of
unied data policies and DataOps—
and they need to institute them.
Third, a company’s IT infrastructure
needs to be customized to support
the use of AI and, in particular,
the edge devices that enable
real-time data gathering, analysis,
and use. It’s important to have a
robust infrastructure that includes
hardware and software platforms
that gather and manage huge
amounts of data from automation.
Business owners should work
closely with their IT departments
to secure the most appropriate
platforms and ensure they’re
located where they need to be.
For many, that means having edge
devices close to factory equipment,
rather than offsite.
Fourth, employees must be
retrained and reskilled to be
effective. It’s about enabling data
agility: organizations have to
build a talent base that’s adept at
using big data to make decisions,
whether sourcing new talent with
the right skills or retraining and
reskilling employees. The result
would be prepared employees
who thrive in a data-driven future.
Fifth, organizations should
consider longer-term investments
to get ready for the future. As the
COVID-19 pandemic has shown
us, readiness for the long term
matters a great deal.
In sum, APJ businesses are still
growing in their understanding
of how data management can
boost the value of data. The
region appears to be slightly more
conservative, for example, when
it comes to putting data in the
cloud or changing data locations.
The region’s greatest catalyst for
change is improving data security.
There’s a reluctance—whether
associated with means or with
lack of data education—to get out
of a comfort zone when it comes
to data processes: APJ has the
opportunity to invest in DataOps
in order to maximize the value of
its growing data.
In the aftermath of the onset of a
global pandemic that resulted in
many more employees working
from home, it is even more critical
for enterprises to take data
management more seriously.
NA China
Europe
APJ
Internally managed
enterprise data
centers
Third-party managed
enterprise data
centers
Edge data centers
or remote locations
where data is
centrally stored
Cloud repositories
(public, private,
industry)
Other locations
-5%
7%
3%
-1%
1%
-12%
9%
20%
-10%
-13%
0%
-3%
2%
-9%
14%
-4%0%-1%
-10%
10%
Expected Changes in How Data Is Stored—
Over the Next Two Years
FIGURE 5
Source: The Seagate Rethink Data Survey, IDC, 2020
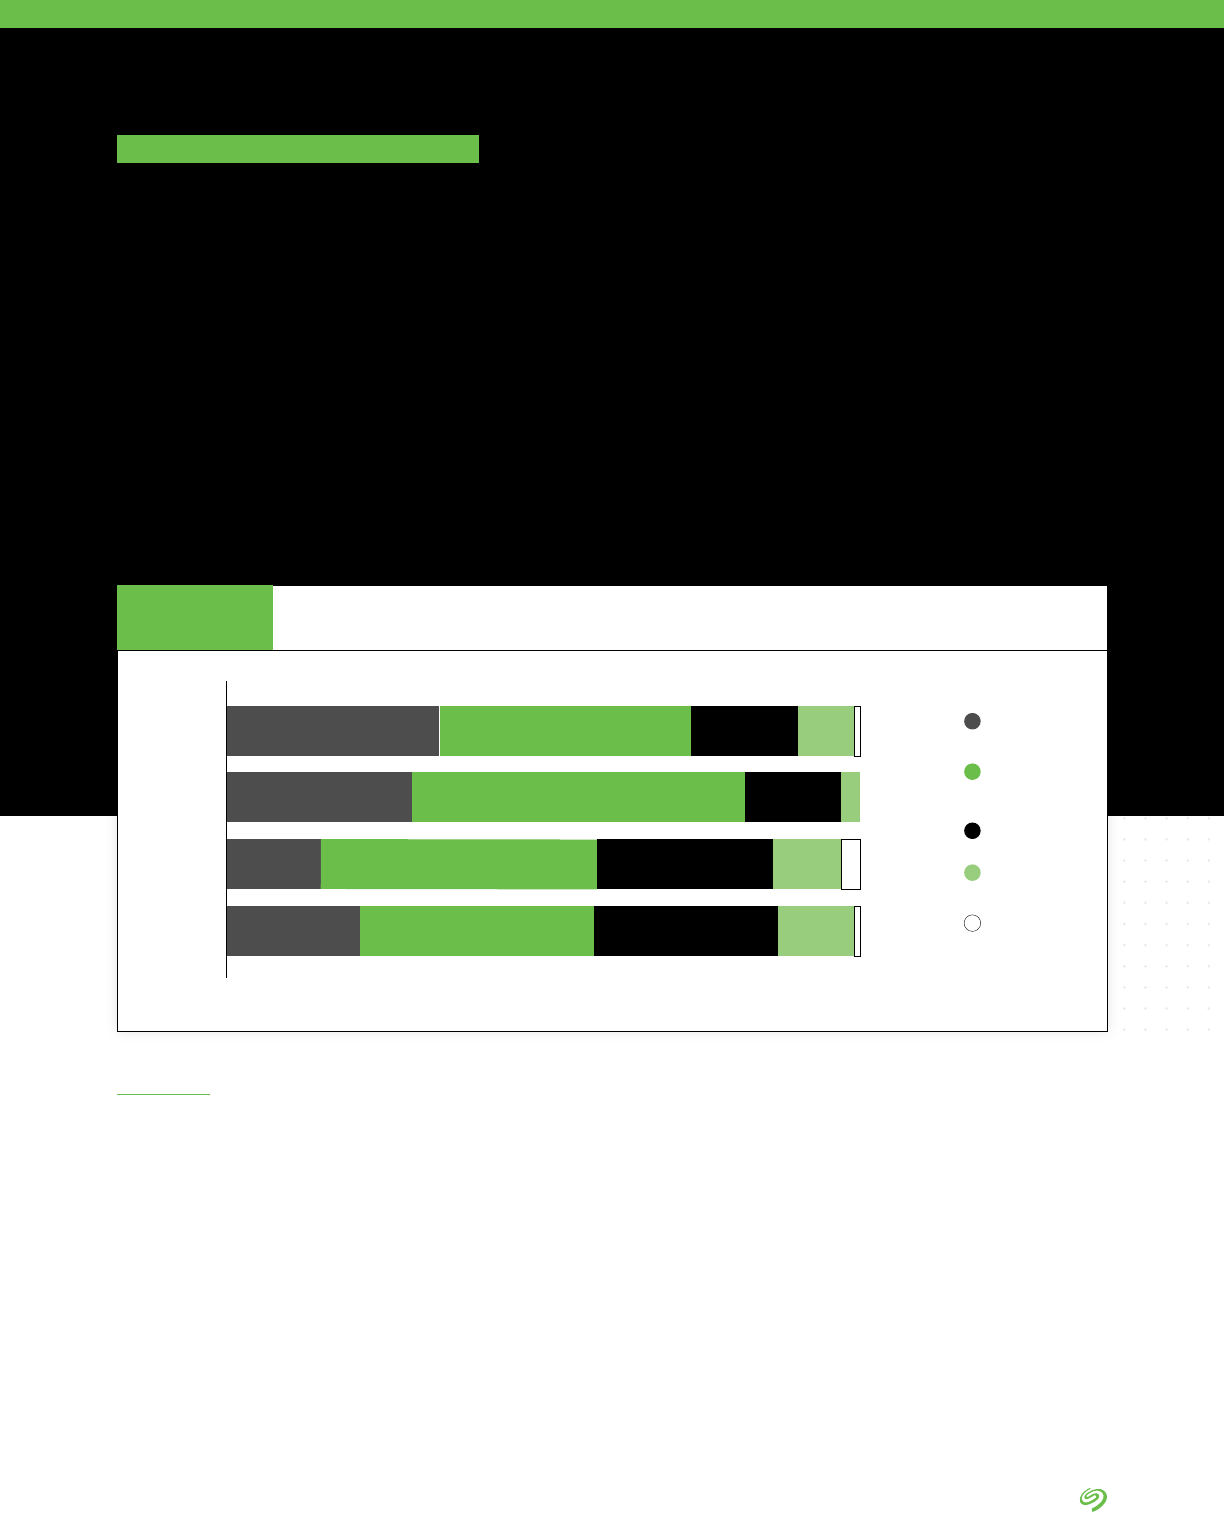
RETHINK DATA: PUT MORE OF YOUR BUSINESS DATA TO WORK—FROM EDGE TO CLOUD | 44 |
CHAPTER TWO
For the purposes of this survey, China is a stand-
alone region. This makes sense because of its
expansiveness, homogeneity, and geopolitical
uniqueness.
China
The survey shows that China
is the most progressive region
when it comes to taking on data
management challenges.
• Of all regions, DataOps is most
likely to be seen as “very” or
“extremely” important in China.
When asked how important they
felt the concept of DataOps
was, 52% of respondents said
“very important” and 29% said
“extremely important”—a total of
81% (Figure 6).
• When it comes to factors
inuencing data growth, China
is most aggressive about data
analytics (54% of respondents,
tied with APJ) and least focused
on modernizing legacy apps
(Figure 7).
• In the coming two years,
respondents project that 20%
more enterprise data will move
to cloud repositories (by far the
biggest percentage among the
regions) and 9% more will migrate
to edge data centers (Figure 8).
• Enterprise data management is
more centralized in China than in
other regions. A high percentage
DATA BY IDC
Not very
important
Somewhat
important
Important
Very
important
Extremely
important
NA
China
Europe
APJ
40% 17%34% 9% 1%
3%
52% 15%29%
44% 28%15% 11% 3%
37% 29%21% 12% 1%
Importance of DataOps
FIGURE 6
Source: The Seagate Rethink Data Survey, IDC, 2020
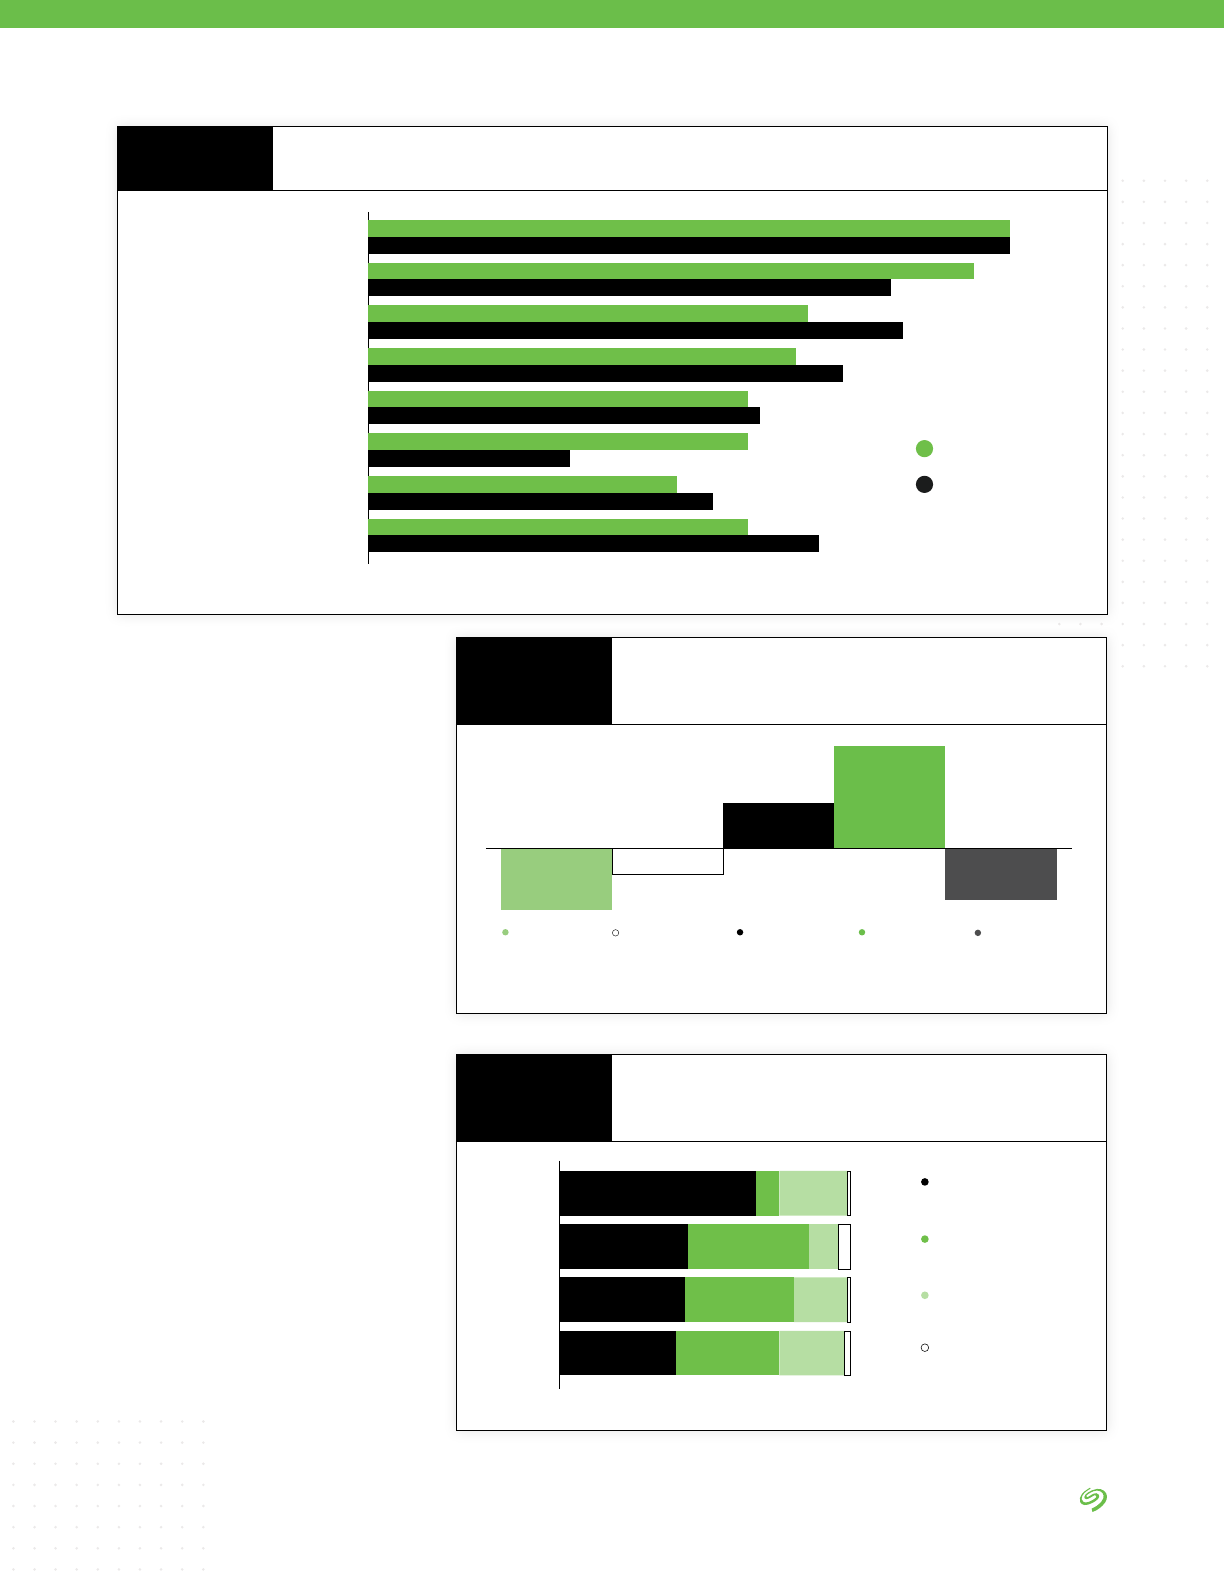
RETHINK DATA: PUT MORE OF YOUR BUSINESS DATA TO WORK—FROM EDGE TO CLOUD | 45 |
(67%) of enterprises in China use
just one dedicated centralized
group as a data management
function (Figure 9).
• China is behind other regions
when it comes to integration of
data management—but it is most
interested in integration (Figure 10).
• China reports the highest degree
of challenges in exploiting data’s
full potential—including making
collected data usable, managing
the storage of collected data,
ensuring data’s security, and
making different silos of collected
data available (Figure 11).
Managed in an
ad-hoc way
Managed separately
for each application
or infrastructure type
Organized by
business unit/
subsidiary
One dedicated
centralized group
across the enterprise
NA
China
Europe
APJ
67%
44%
43%
40%
37%
41%
8%
35%
18%
11%
23%
22%
1%
4%
1%
2%
Increased use of advanced
data analytics
Increased use of IoT devices to
automatically gather data
Migrating on-premise
applications to the cloud
Increased use of SaaS
applications
Increase in edge application
development
Modernizing legacy applications
Increase in on-premise
app deployments
Changing operating systems
(OS) environments
China
APJ
54%
54%
51%
44%
37%
45%
36%
40%
32%
38%
26%
29%
32%
17%
32%
33%
Factors Impacting Data Growth
FIGURE 7
Internally managed
enterprise data
centers
Third-party managed
enterprise data
centers
Edge data centers
or remote locations
where data is
centrally stored
Cloud repositories
(public, private,
industry)
Other locations
-5%
-12%
9%
20%
-10%
Expected Changes in How Data Is
Stored Over the Next Two Years
FIGURE 8
Source: The Seagate Rethink Data Survey, IDC, 2020
Source: The Seagate Rethink Data Survey, IDC, 2020
Source: The Seagate Rethink Data Survey, IDC, 2020
How Data Management Functions
Are Organized
FIGURE 9

RETHINK DATA: PUT MORE OF YOUR BUSINESS DATA TO WORK—FROM EDGE TO CLOUD | 46 |
Chinese organizations’ data
management capabilities are
growing fast. Its enterprises
understand the power of DataOps.
Centralized data management may
improve the ability to exploit data by
reducing silos. While centralization
of policy management is important,
integrating data management
functions is the next level of data use.
China doesn’t perform as well in
integrating data, but respondents
see data integration as a key goal in
the next two years.
Several large cloud providers are
based in China, so the local market
is ready for cloud adoption. This
may be why the region reports the
highest levels of migration to the
cloud (public, industry, and private).
A lot of this data is generated by
the proliferation of IoT devices,
sensors, and AI algorithms.
Growing adoption of public cloud
Iaas resources offered by regional
providers is also driving the move
to the cloud.
China is most driven to increase data
access and analytics and least driven
to reduce costs. Because of the state
of China’s IT maturity, we believe
the region has fewer legacy apps to
burden its competitive efforts.
What It Means
ANALYSIS BY IDC
Fully integrated
on one platform
Mostly
integrated
Majority are
integrated
Some are
integrated
None are
integrated
Integrated Data Management
China NA Europe APJ
Interest in Integrated Data Management
10%
45%
28%
15%
7%
25%
41%
26%
9%
32%
39%
18%
10%
39%
33%
15%
China NA Europe APJ
10%
35%
35%
25%
5%5%
23%
39%
32%
9%
30%
37%
22%
10%
33%
35%
18%
Fully integrated
on one platform
Mostly
integrated
Majority are
integrated
Some are
integrated
None are
integrated
FIGURE 5
Integration of Data Management—Current vs. in Two Years
FIGURE 10
Source: The Seagate Rethink Data Survey, IDC, 2020

RETHINK DATA: PUT MORE OF YOUR BUSINESS DATA TO WORK—FROM EDGE TO CLOUD | 47 |
In China, data is on the move—from
on premises to cloud and the edge.
China is in an invest-to-grow
phase of economy, which is true
for a lot of Chinese companies.
When enterprises are in this
mode, they have less focus on
prot and loss (P&L). They instead
focus on prot for the long term.
This means they choose to invest
in growth so they can eventually
see prot at scale.
Chinese enterprises do not have
to concern themselves with
updating legacy applications—
apps developed and architected in
the client server era, typically on-
prem apps that are single-tenant.
(Examples include hardware in
power plants, manufacturing
machines controlled by computers
running MS-DOS, or outdated
nancial systems.) This means that
their budget is freed up to invest in
data movement (to the cloud and
edge) and to exploit the value of
data with streamlined DataOps.
Chinese respondents report the
highest degree of difculty when
it comes to taking advantage
of data: this may simply be a
reection of Chinese businesses’
ambitions and their intense
focus on growth, plus the reality
that they nd themselves in the
trenches of DataOps adoption.
It may be that China lags most
“behind” when it comes to integrating
data management functions precisely
because of its centralization—and
because there are no legacy apps to
worry about integrating. China is a
growing economy strongly driven
by government and legislation,
as opposed to many Western
economies.
AI is a huge initiative in China,
partly because of the massive
volumes of data generated by the
enormous population of around 1.4
billion. AI is touted as one of the
leading initiatives that China uses
to compete on a global scale. The
country’s government supports the
development of AI, 5G, hyperscale
data centers, and other means of
accelerating data on the move.
As a result of these factors,
China’s infrastructure is a lot more
pliable. China has implemented
its New Infrastructure project
to boost the digital economy.
Combined with technology, this
initiative could also translate into
new business opportunities for
enterprise data management.
Data on the Move
SEAGATE POV
Making collected
data usable
China NA Europe APJ
Managing the storage
of collected data
Ensuring that needed
data is collected
Ensuring the security of
collected data
Making the different silos of
collected data available
Getting the required
resources to manage
collected data
Having the technology in
place to analyze data
Establishing data
management governance
and processes
Building the people resources
needed to analyze data
Connecting the curated
data with data users
37%
41%
39%
38%
China NA Europe APJ
39% 39%
35% 35%
China NA Europe APJ
39%
37%
38%
33%
China NA Europe APJ
39%
38%
33%
35%
China NA Europe APJ
41%
32%
24%
31%
China NA Europe APJ
37%
30%
26%
27%
China NA Europe APJ
27%
24%
23%
29%
China NA Europe APJ
29% 29%
22%
24%
China NA Europe APJ
19%
23%
22%
21%
China NA Europe APJ
11%
6% 6%
8%
Source: The Seagate Rethink Data Survey, IDC, 2020
Main Challenges in Exploiting Data’s Potential
FIGURE 11
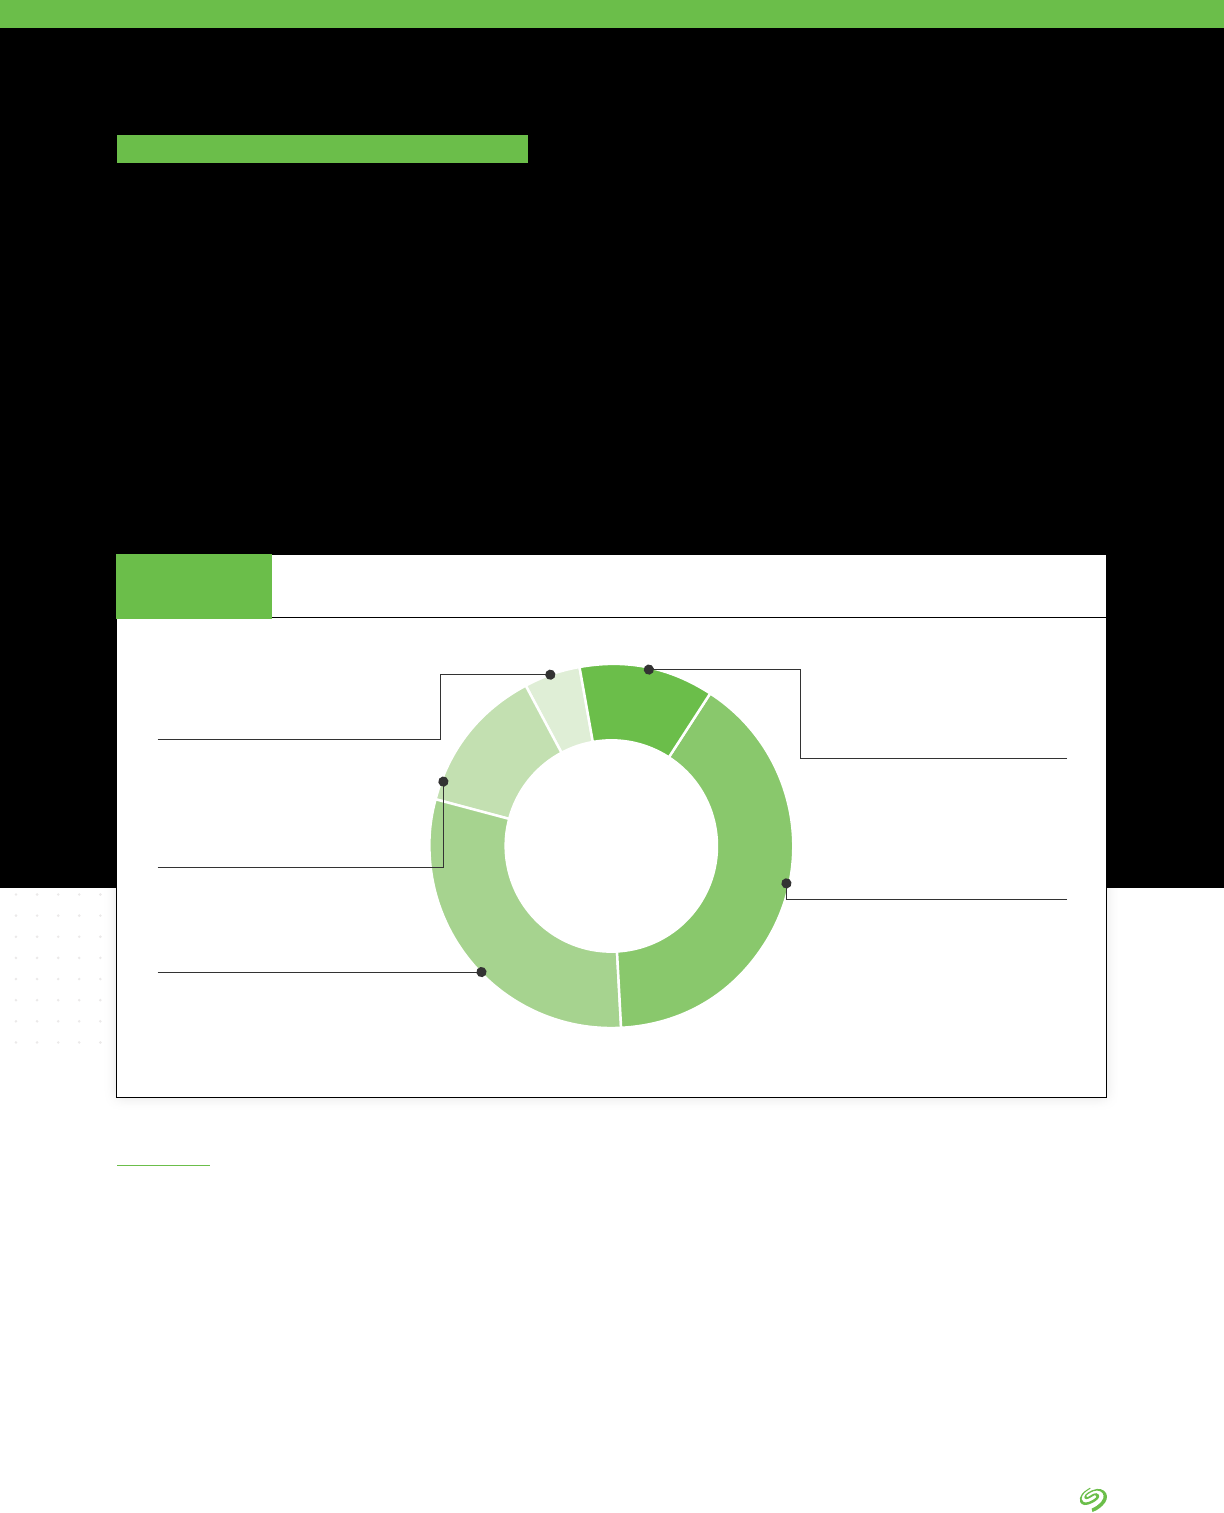
RETHINK DATA: PUT MORE OF YOUR BUSINESS DATA TO WORK—FROM EDGE TO CLOUD | 48 |
An important note while examining
the European data is that the region
tends to respond conservatively
versus other regions in nearly all
global surveys across a variety of
subjects. The region’s surveyed
countries include three Western
European powers and Russia.
• Europe has the least-implemented
DataOps discipline of all regions.
Only 18% of the region’s
respondents report that its
DataOps capacity has been fully or
partially implemented (Figure 12).
• But European companies
understand the need for DataOps.
As many as 86% of respondents
say that DataOps is “extremely
important,” “very important,” or
“important” (Figure 13).
• The region’s data growth rate
is also the lowest compared to
other regions (Figure 14).
DATA BY IDC
CHAPTER THREE
The survey queried enterprises from four
European countries: the United Kingdom, France,
Germany, and Russia.
Europe
Have started to build DataOps capacity
30%
13%
DataOps capacity has been
partially implemented
40%
Considered and planning to
build DataOps capacity
12%
Not considered this
separately at all
5%
DataOps capacity has been fully
implemented across the organization
Europe
Source: The Seagate Rethink Data Survey, IDC, 2020
State of DataOps in the Organization
FIGURE 12
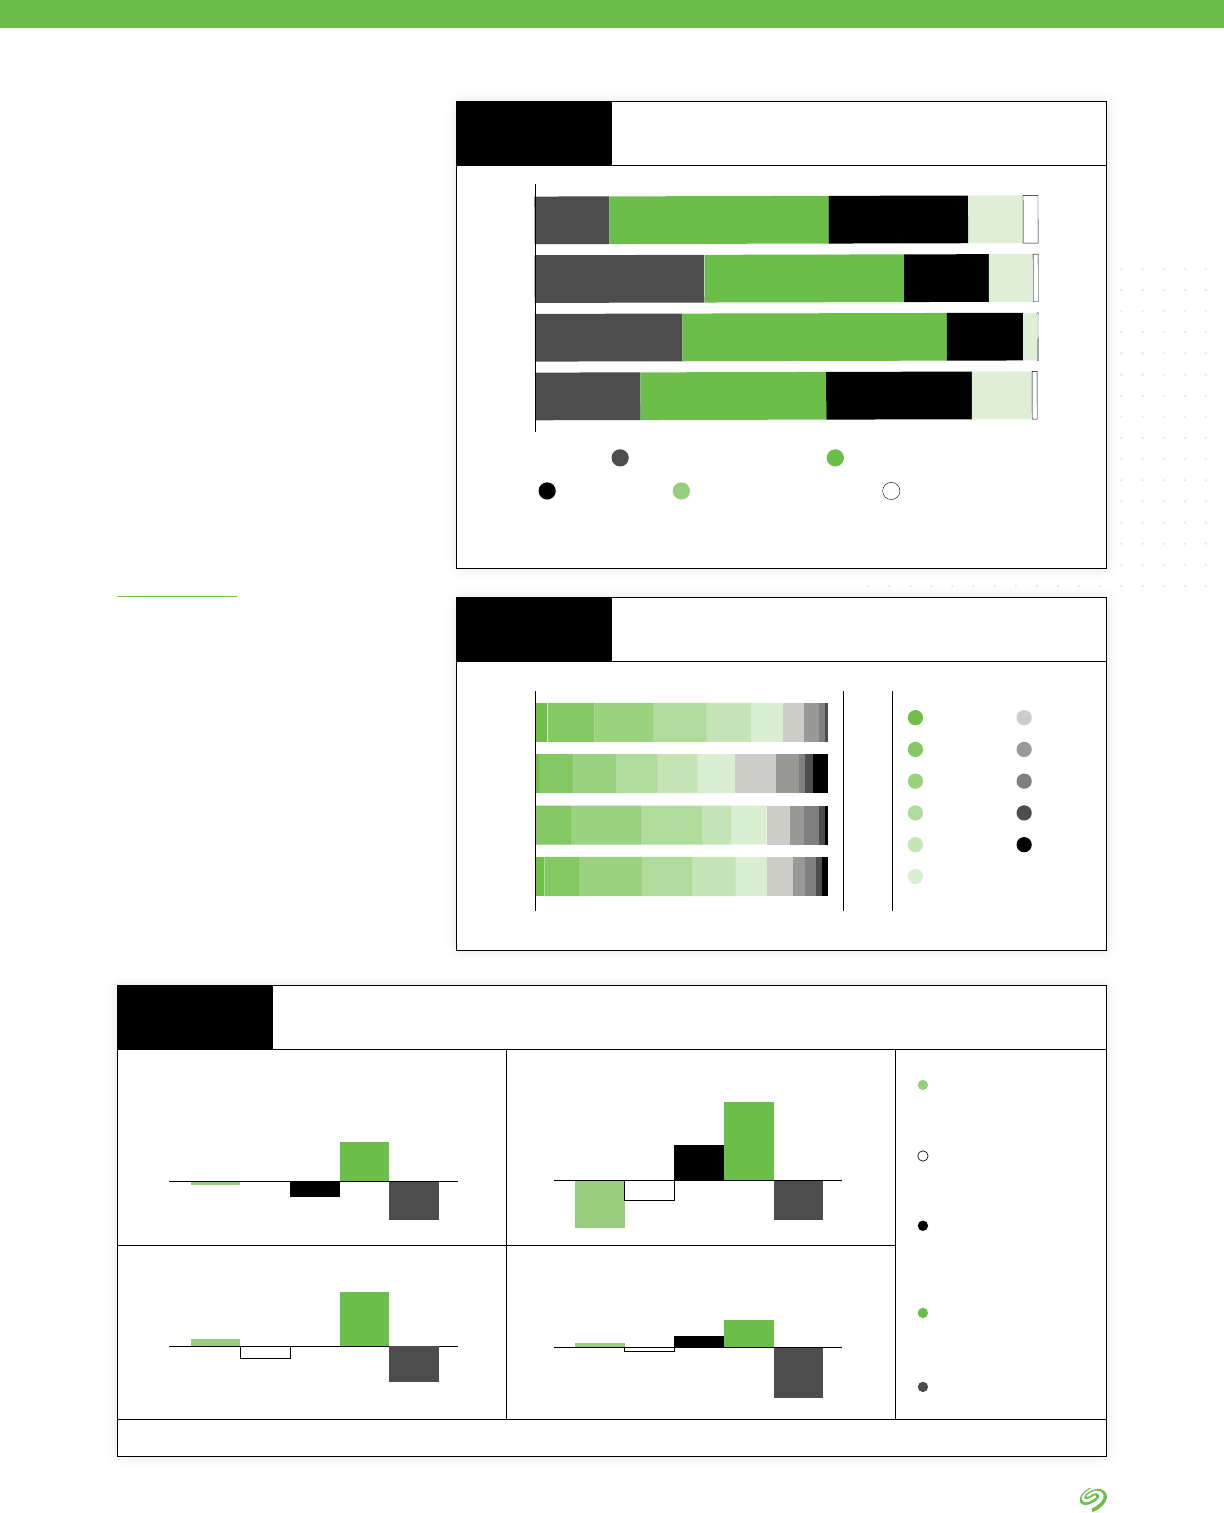
RETHINK DATA: PUT MORE OF YOUR BUSINESS DATA TO WORK—FROM EDGE TO CLOUD | 49 |
• European organizations are
moving data to the cloud. Over
the next two years, 14% of
enterprise data is going to shift
to the cloud (Figure 15). Factors
impacting data growth include
migrating on-prem apps to the
cloud and increase in on-prem
app deployments (Figure 16).
• When it comes to factors deciding
how data is stored, Europe is
driven to increase security and
reduce costs when determining
its data storage (Figure 17).
52%
37%
40%
44%
15%
29% 12% 1%
17% 1%
0%
9%
28% 3%11%
21%
29%
34%
15%
Not very importantSomewhat importantImportant
Very importantExtremely important
Europe
NA
China
APJ
3%
Europe
avg.
NA
China
APJ
38%
49%
43%
43%
Less than 10%
10% to 19%
20% to 29%
30% to 39%
40% to 49%
50 to 59%
60 to 69%
70 to 79%
80 to 89%
90 to 99%
100% or
more
NA China
Europe
APJ
Internally managed
enterprise data
centers
Third-party managed
enterprise data
centers
Edge data centers
or remote locations
where data is
centrally stored
Cloud repositories
(public, private,
industry)
Other locations
-5%
7%
3%
-1%
1%
-12%
9%
20%
-10%
-13%
0%
-3%
2%
-9%
14%
-4%0%-1%
-10%
10%
Importance of DataOps
FIGURE 13
Expected Annual Data Growth Rate
FIGURE 14
Expected Changes in How Data Is Stored—Over the Next Two Years
FIGURE 15
The less time organizations
spend focused on legacy apps
(e.g., updating them), the more
resources they can put toward new
innovations. The reverse also holds.
Europe is focused on updating
existing applications and on on-
prem applications. On-prem
apps, because of their inherent
architecture and dependence
What It Means
ANALYSIS BY IDC
Source: The Seagate Rethink Data Survey, IDC, 2020
Source: The Seagate Rethink Data Survey, IDC, 2020
Source: The Seagate Rethink Data Survey, IDC, 2020

RETHINK DATA: PUT MORE OF YOUR BUSINESS DATA TO WORK—FROM EDGE TO CLOUD | 50 |
In addition to the more mature
region’s preponderance of legacy
apps, data sovereignty and data
privacy play a great role in Europe
because of the region’s stricter
regulatory system and geopolitical
diversity. There’s a burden to do
well by one’s investments—in
this case, investments made
in the existing, older structures
and apps. It’s a kind of path
dependency, as is the logic of
wanting to recoup already-incurred
costs rather than venturing out
into new, costlier arrangements.
The value placed on data privacy
outweighs the additional costs and
it may slow the migration of data
to the cloud, which nevertheless
remains strong at 14% projected
in the next two years.
A Mix of Legacy Apps and DataOps Readiness
SEAGATE POV
on their in-place local compute
and storage resources, generally
have less agility than cloud apps.
COVID-19 has brought this issue
to the fore, as organizations are
looking to use the cloud to quickly
adapt. Europe may not be as agile
in infrastructure as other regions.
This can hinder the movement of
data, and its value.
Pan-European organizations may
use common apps, but because
of GDPR and other regulations
they cannot share that data across
borders. Thus, regulations—more
than data management technology—
may inhibit their ability to fully leverage
data compared to, say, APJ-based
organizations. Organizations bound
by regulation will need to expend
more effort and be more creative to
exploit the value of the data available
to them. DataOps can provide an
avenue for this.
Because European companies need
to maintain legacy applications while
complying with local regulations, they
become quite TCO-conscious. Issues
and regulations related to GDPR, data
privacy, and the right to be forgotten
complicate data management—and
are all rather costly. Privacy protection
is often achieved through secure
data silos, which can stie data
management innovation.
There are different motivations
for moving to the cloud. One is
to increase organizational agility,
the other is to reduce the cost
of hosting applications or storing
data. One hypothesis is that
Europe’s organizations are more
driven by the latter.
Migrating on-premise
applications to the cloud
Europe NA China APJ
40%
39%
45%
37%
Increase in on-premise
application deployments
Europe NA China APJ
38%
32%
29%
26%
Two Factors Impacting Data Growth by Region
FIGURE 16
Source: The Seagate Rethink Data Survey, IDC, 2020
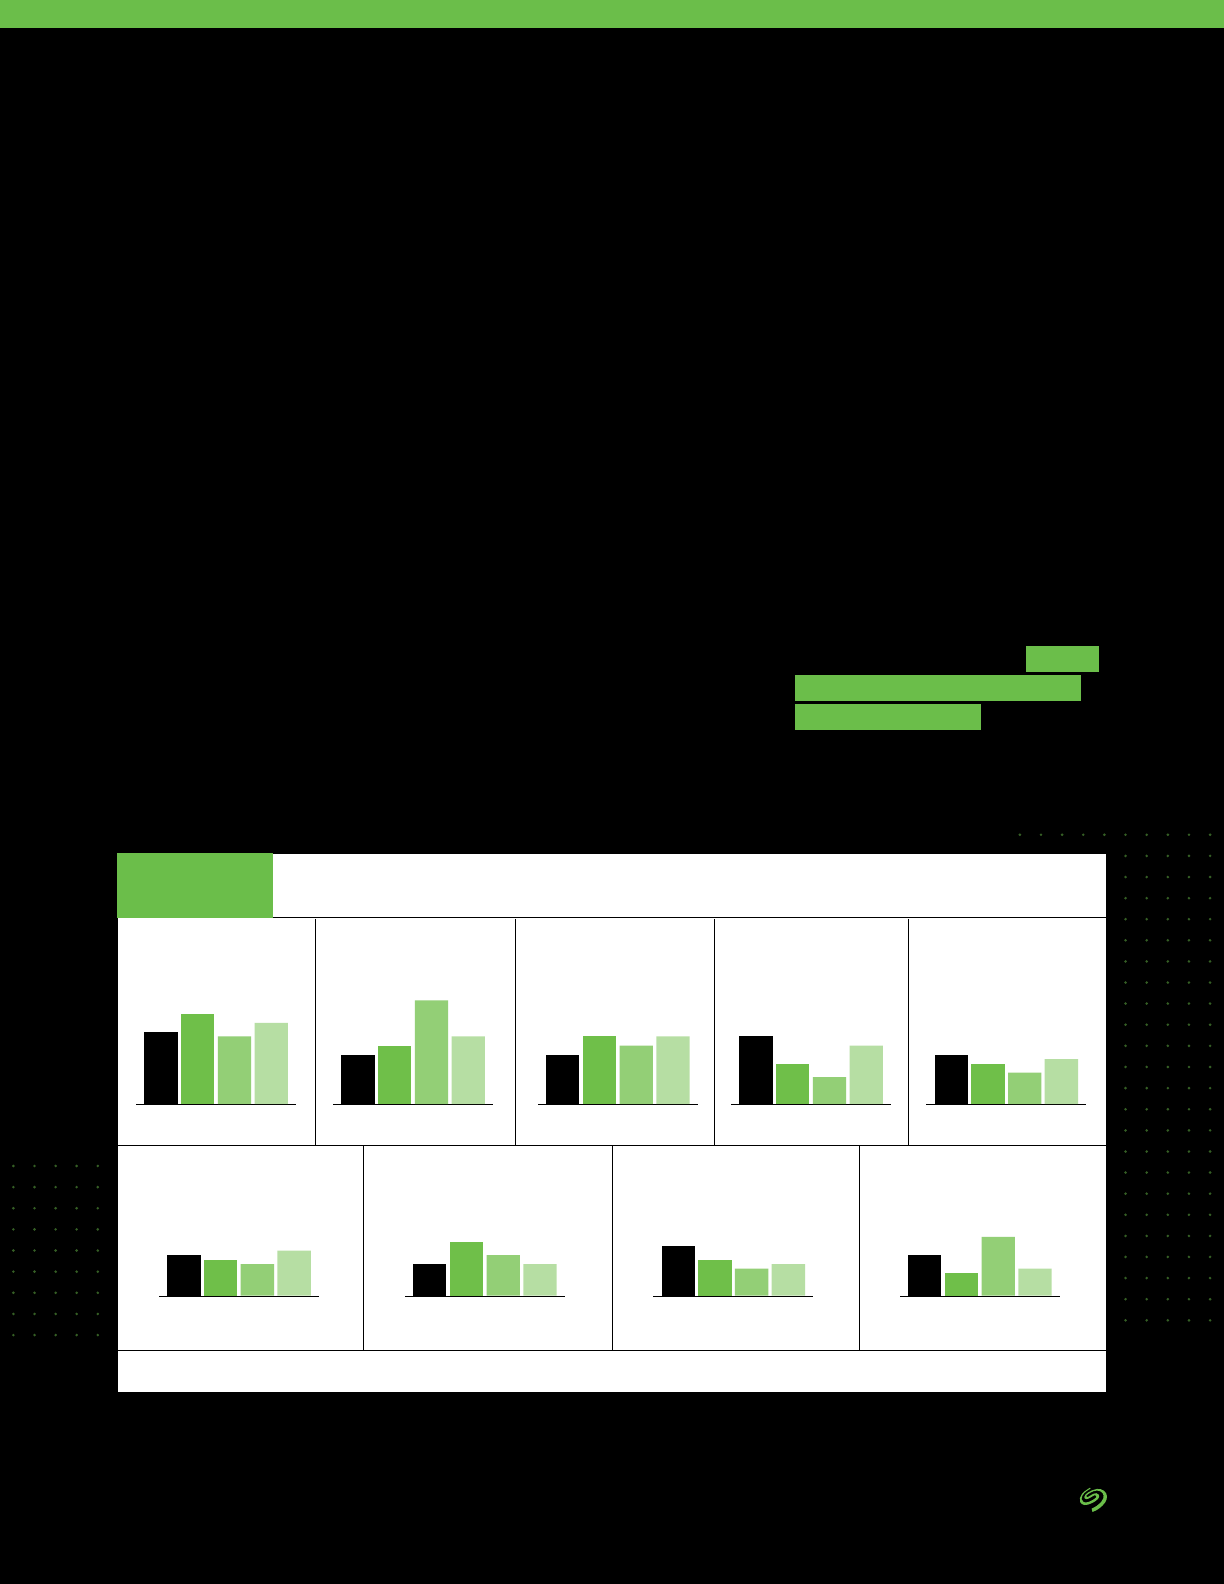
RETHINK DATA: PUT MORE OF YOUR BUSINESS DATA TO WORK—FROM EDGE TO CLOUD | 51 |
Europe’s enterprise data is growing
at 38%. This may be slightly slower
than other regions, but faster than
the predicted general data growth
for all sectors, which IDC had
previously put at 32%. Considering
the maturity and regulatory
conservatism regarding putting data
to work in Western Europe and the
relative newness of IT development
in some parts of Russia, the 38% is
quite impressive.
According to Seagate-sponsored
IDC report The EMEA Datasphere
1
,
nearly a third of the global
datasphere growth results from
growth of video surveillance,
signals from IoT devices,
metadata, and entertainment.
Whether it’s surveillance growth in
the United Kingdom and France,
manufacturing in Germany, or
growth in Russia’s mining industry,
data is playing a much more
critical role these days. In order
to make better use of this data,
the region’s organizations would
do well to avail themselves of the
power of DataOps.
The survey found that, in addition
to improving data security, TCO
is the main driver in decisions
regarding where the data should
be stored (Figure 17). This could
explain the migration to the cloud.
As European enterprises were
too focused on maintaining and
updating the legacy apps, they
could not invest signicantly in
innovation, because those apps
lack agility compared to cloud
ones. To quickly adapt to changing
business conditions, Europe’s data
infrastructure needs to be more
agile. Migration to the cloud could
also be the solution to quickly
and cost-effectively adapt to
new business environments and
challenges like the COVID-19 era.
Cloud migration can in many
cases boost business innovation,
making it more agile. But the
challenge that the European
companies now face is data
management. As they store data
in hybrid cloud and in multicloud,
efcient data management will be
a must in order to derive optimal
value from data.
This need could explain the nding
that 40% of Europe’s enterprises
are planning to build DataOps
capacity and 30% already are in
the process of building it. Europe
is conscious of the urgency to
implement DataOps in order to
get the most out of data.
Improving data security
Europe NA China APJ
Increasing access for data
analytic and management
services (AI/ML, IoT, etc.)
Increasing visibility and
manageability of IT
infrastructure operations
Reducing cost/TCO
of infrastructure
Providing faster access
to data for applications
and business units
Meeting increases in data
capacity requirements
Improving ease of use Improving availability and
increasing uptime
Integrating third-party
services to use alongside
modern infrastructure
Europe NA China APJ Europe NA China APJ Europe NA China APJ Europe NA China APJ
11%
9%
7%
10%
Europe NA China APJ Europe NA China APJ Europe NA China APJ Europe NA China APJ
16%
20%
15%
18%
11%
13%
23%
15%
11%
15%
13%
15%
15%
9%
6%
12%
9%
8%
7%
10%
7%
12%
9%
7%
11%
8%
6%
7%
9%
5%
13%
6%
Factors Driving the Changes in How Data Is Stored
FIGURE 17
Source: The Seagate Rethink Data Survey, IDC, 2020
1 The EMEA Datasphere, IDC, 2019

RETHINK DATA: PUT MORE OF YOUR BUSINESS DATA TO WORK—FROM EDGE TO CLOUD | 52 |
CHAPTER FOUR
The survey queried enterprises in the United
States and Canada.
North America (NA)
NA is leading other regions when
it comes to the integration of data
management functions.
• 45% of NA organizations report
having a single, enterprise-
wide data policy application,
compared to 38% in Europe and
34% in APJ (Figure 18).
• NA is the region with the most
projected data growth. The
region’s enterprise datasphere
is set to grow at nearly 50%
(faster than the global average
of 42.2%) (Figure 19).
• NA has the most advanced
DataOps implementation.
The region has the greatest
number of respondents who say
DATA BY IDC
Back-up/recovery
EuropeChina
40%
NA
36%
32%
China
35%
NA
39%
Europe
31%
China
36%
NA
45%
Europe
38%
China
33%
NA
38%
Europe
31%
China
36%
NA
36%
Europe
36%
China
34%
NA
36%
Europe
34%
China
28%
NA
35%
Europe
35%
China
34%
NA
38%
Europe
37%
China
39%
NA
38%
Europe
35%
China
27%
NA
41%
Europe
34%
Container orchestration Policy management Data discovery Data classication
Metadata management Recovery orchestration Data security for data
being stored
Data security for data
on the move
Data migration, tiering,
or placement
APJ
33%
APJ
29%
APJ
34%
APJ
30%
APJ
27%
APJ
30%
APJ
29%
APJ
28%
APJ
28%
APJ
30%
Source: The Seagate Rethink Data Survey, IDC, 2020
Proportion of Respondents Reporting Their Organizations
Have a Single Enterprise-Wide App for Policy Management
FIGURE 18
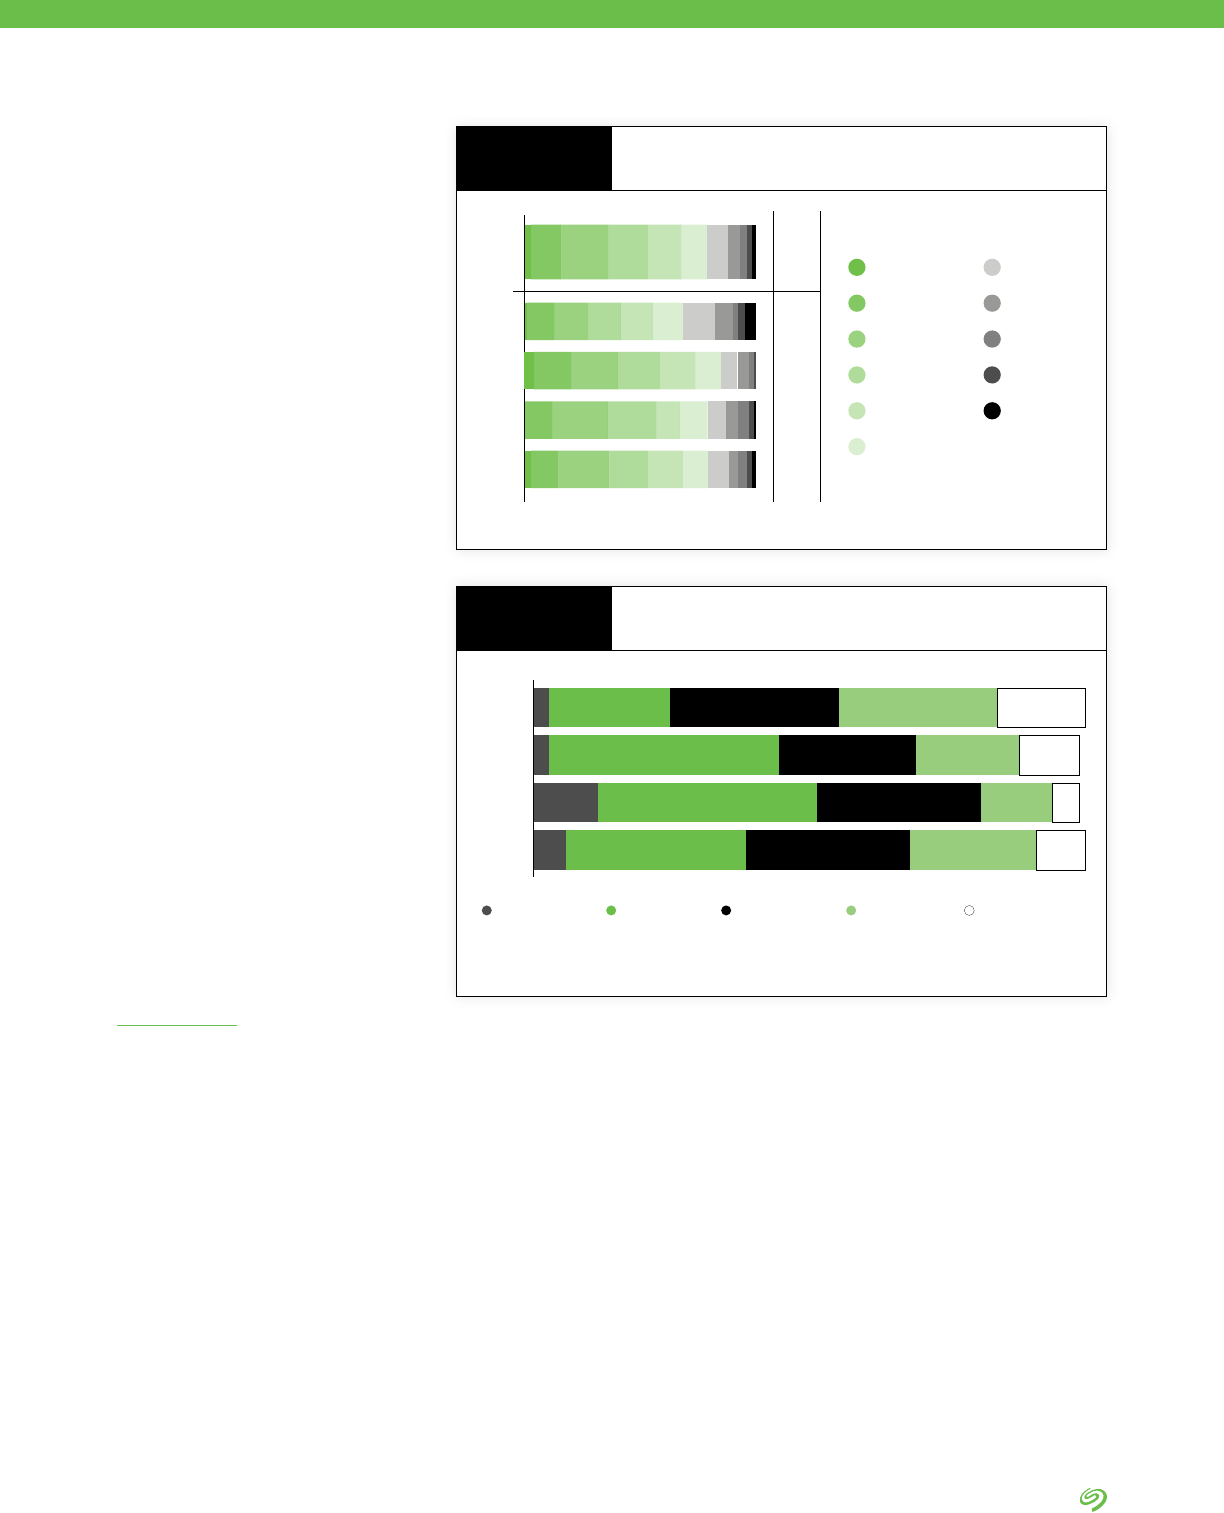
RETHINK DATA: PUT MORE OF YOUR BUSINESS DATA TO WORK—FROM EDGE TO CLOUD | 53 |
avg.
NA
Tot a l
China
APJ
Europe 38%
49%
42.2%
43%
43%
Less than 10%
10% to 19%
20% to 29%
30% to 39%
40% to 49%
50 to 59%
60 to 69%
70 to 79%
80 to 89%
90 to 99%
100% or more
that DataOps—the discipline
connecting data creators
with data consumers—has
been either fully or partially
implemented: a total of 45% of
respondents (Figure 20).
• When it comes to determining
how their data is stored, NA
enterprises are most driven by
improving data security (20%)
(Figure 21).
• NA organizations are farthest
along in getting the most value
out of their data (Figure 22).
• NA’s greatest challenges in
taking full advantage of data
are making collected data
usable, managing the storage
of collected data, ensuring the
security of collected data, and
ensuring that needed data is
collected (Figure 23).
DataOps capacity
has been fully implemented
across the organization
DataOps capacity
has been partially
implemented
Have started to build
DataOps capacity
Considered and
planning to build
DataOps capacity
Not considered this
separately at all
NA
22% 31%3% 29% 16%
China
42% 25%3% 19% 11%
Europe
40% 30%12% 13% 5%
APJ
33% 30%6% 23% 9%
A unied policy mechanism is the
most efcient, automated way
to manage data consistently at
scale. Arguably, it is the only way
to manage data consistently, as
manual efforts are not realistic
for medium- or large-scale
organizations. Policy management
is foundational to data management
and to leveraging that data.
Based on this survey, it appears
that NA organizations are moving
most aggressively to implement
unied data policies throughout
organizations and are most adept at
using DataOps to derive maximum
value from data.
In general, an enterprise-wide data
management policy application (i.e.,
a way to manage policies across
the enterprise) indicates a higher
level of data management maturity.
Therefore, the organizations that
implement it are better equipped
to fully leverage the value of the
data available to them. Certainly,
having an enterprise-wide policy
application is not assurance of
competitive advantage, but it
What It Means
ANALYSIS BY IDC
Expected Annual Data Growth Rate
FIGURE 19
State of DataOps in the Organization
FIGURE 20
Source: The Seagate Rethink Data Survey, IDC, 2020
Source: The Seagate Rethink Data Survey, IDC, 2020
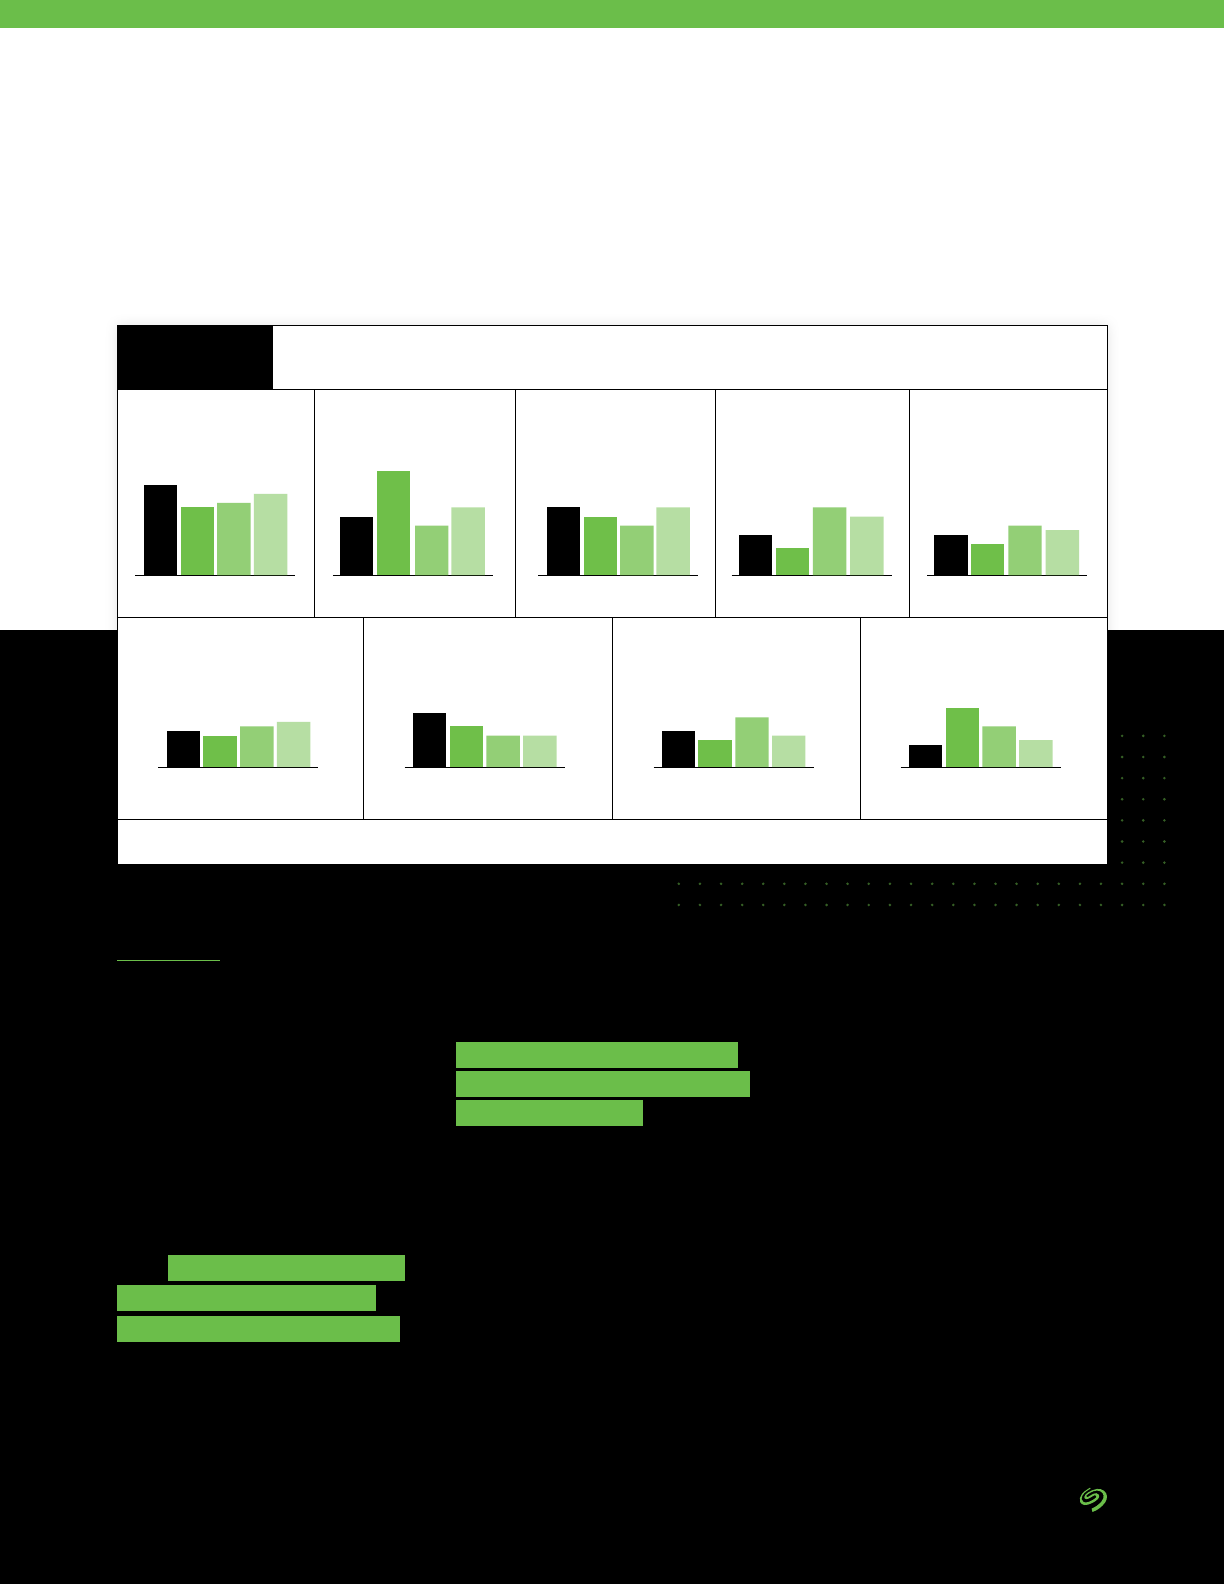
RETHINK DATA: PUT MORE OF YOUR BUSINESS DATA TO WORK—FROM EDGE TO CLOUD | 54 |
is a key indicator that would be
used in a benchmark to compare
organizations.
Organizations focused on reducing
costs may not be making all the
necessary investments needed to
keep up with organizations that are
focused on improving data access
and extracting value from data.
NA organizations appear to be
focused on data security, perhaps
for regulatory reasons and/or in
order to maintain IP protection.
In the next two years, enterprise
data is projected to grow at the
average annual data growth rate
of 42.2%. That’s a lot more than
32% the projected annual average
(for all kinds of data, not just
enterprise) previously projected by
IDC
1
. What sets the NA region
apart is that it is driving up
the 42.2% global rate with an
astonishing 49% of expected
annual data growth in NA over
the next two years.
We can safely conclude that the
NA enterprises are drivers of data
growth. The data growth in this
region is coming from an increased
use of IoT devices to automatically
gather data, increased use of
advanced data analytics, and
increased use of SaaS applications.
When it comes to how NA
businesses determine where to
store data, data security goals
outbid all others. Ascertaining
security risks is a key part of
smoothly functioning DataOps,
as concerns related to hackers,
industry espionage, intellectual
property, and geopolitical defense
A Data Growth Leader
SEAGATE POV
Improving data security
APJ
Increasing access for data
analytic and management
services (AI/ML, IoT, etc.)
Increasing visibility and
manageability of IT
infrastructure operations
Reducing cost/TCO
of infrastructure
Providing faster access
to data for applications
and business units
Meeting increases in data
capacity requirements
Improving ease of use Improving availability and
increasing uptime
Integrating third-party
services to use alongside
modern infrastructure
APJ APJ
11%
9%
7%
10%
Europe
16%
NA
20%
China
15%
18%
Europe
11%
NA
13%
China
23%
15%
11%
15%
13%
15%
Europe
15%
NA
9%
China
6%
12%
9%
8%
7%
10%
7%
12%
9%
7%
11%
8%
6%
7%
9%
5%
13%
6%
APJEuropeNA China
APJEuropeNA China
APJEuropeNA China
APJEuropeNA China
APJEuropeNA China
APJEuropeNA China
FIGURE 4
1 Data Age 2025, sponsored by Seagate with data from Global DataSphere, IDC, May 2020
Source: The Seagate Rethink Data Survey, IDC, 2020
Factors Driving the Changes in How Data Is Stored
FIGURE 21
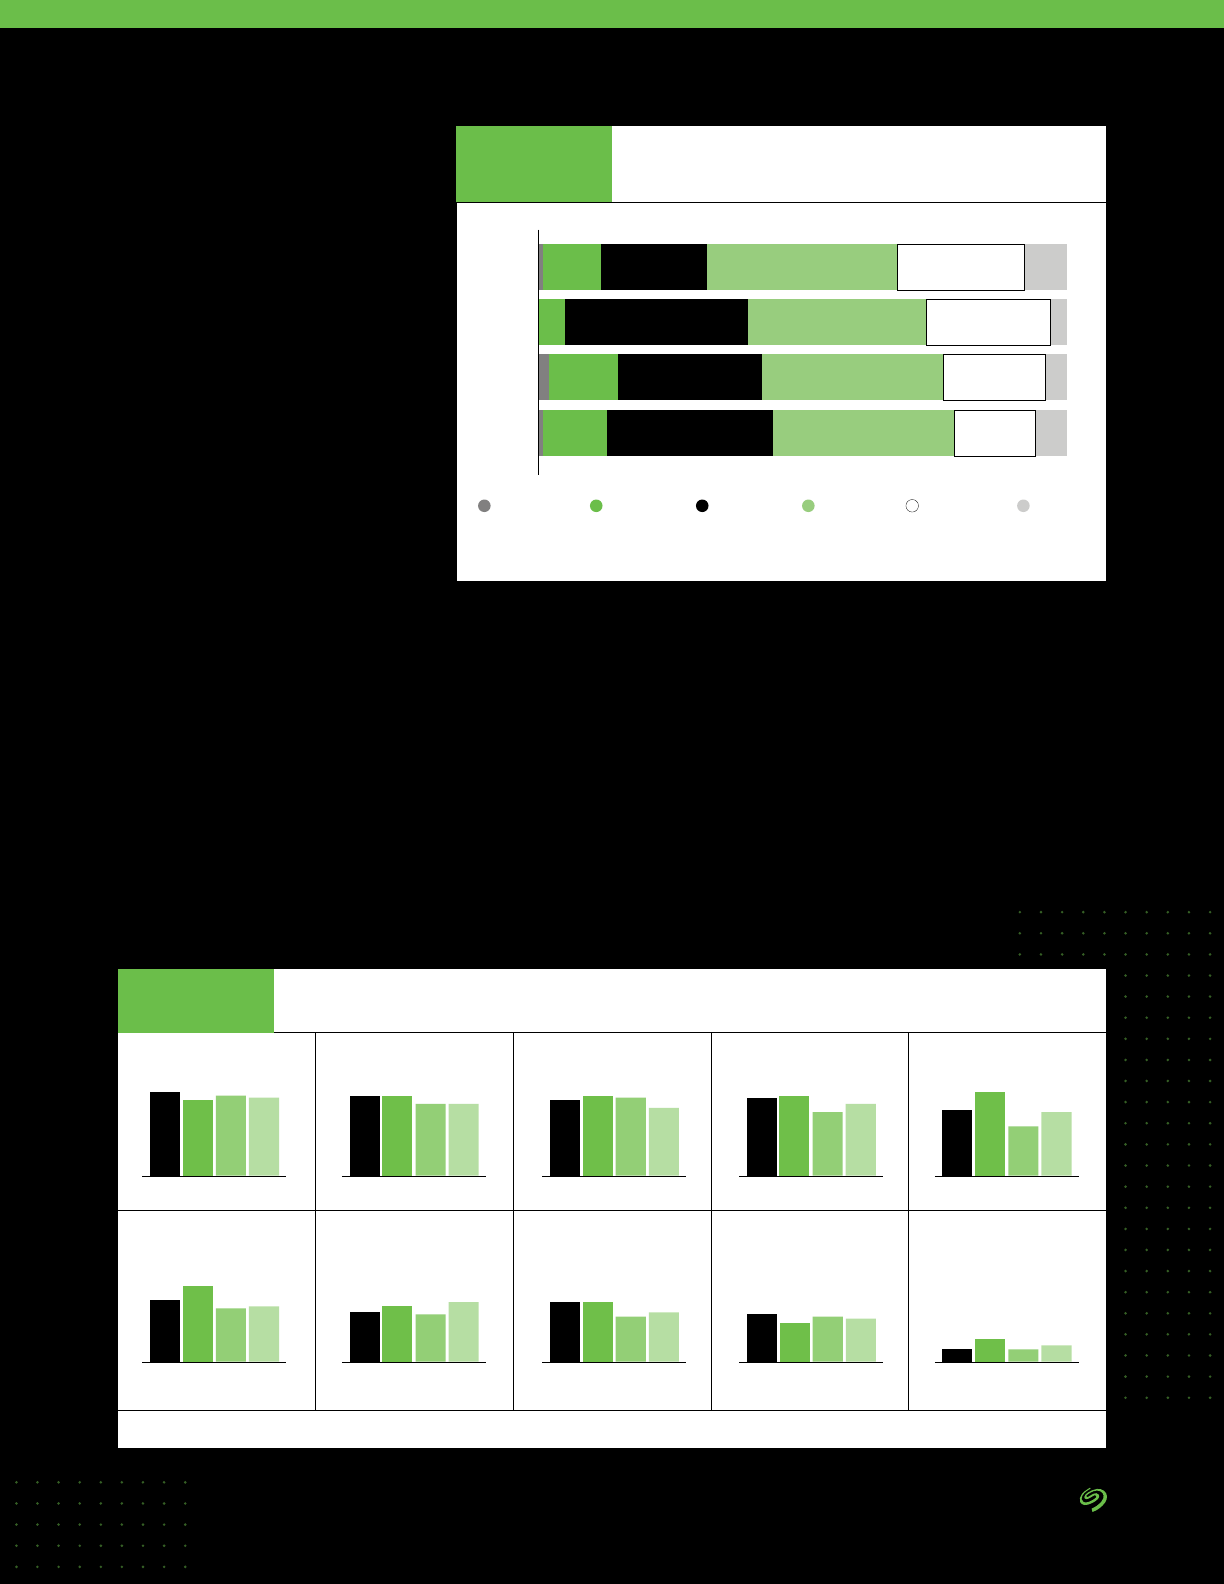
RETHINK DATA: PUT MORE OF YOUR BUSINESS DATA TO WORK—FROM EDGE TO CLOUD | 55 |
are on the minds of owners of
NA organizations. The drive to
protect business data also has
to do with something a lot more
mundane, but just as important:
business continuity. In the US,
there is a great deal of education
and publicity around these data
security issues as NA’s data is
protected at a company level;
there is no national rewall.
With many companies
implementing DataOps or at least
intending to, NA respondents
indicated that they are the
furthest along when it comes to
exploitation of data (Figure 22).
At the same time, they recognized
that the greatest challenges in
taking full advantage of data
included making collected data
usable, managing the storage
of collected data, ensuring the
security of collected data, and
ensuring that needed data is
collected (Figure 23).
Knowing the appropriate storage
environment for various data sets,
classifying data correctly based
on communication between data
creators and business owners,
setting goals for various types of
data, making sure that the needed
data is collected, securing data, as
well as converting collected data to
usable data—these are all concerns
that comprise DataOps.
Respondents from NA in particular
stood out from other regions by
noting their need to improve the
ease of data’s use (Figure 21). This
is useful self-awareness. While
the NA region is fairly advanced in
adopting DataOps and relatively well
educated on the need to implement
it, more education and practice of
the discipline are needed to better
take advantage of available data.
NA
41%
NA
39%
NA
37%
NA
38%
NA
32%
NA
30%
NA
24%
NA
29%
NA
23%
NA
6%
Making collected
data usable
Europe APJChina
37%
39%
38%
Managing the storage
of collected data
Europe APJChina
39%
35% 35%
Ensuring that needed
data is collected
Europe APJChina
39%
38%
33%
Ensuring the security of
collected data
Europe APJChina
39%
33%
35%
Making the different silos of
collected data available
Europe APJChina
41%
24%
31%
Getting the required
resources to manage
collected data
China
37%
Europe
26%
APJ
27%
Having the technology in
place to analyze data
APJChina
27%
Europe
23%
29%
Establishing data
management governance
and processes
Europe APJChina
29%
22%
24%
Building the people resources
needed to analyze data
Europe APJChina
19%
22%
21%
Connecting the curated
data with data users
Europe APJChina
11%
6%
8%
More than 75%
of its potential
100% of its
potential
50-75% of its
potential
25-50% of its
potential
10-25% of its
potential
Less than 10%
of its potential
NA
China
Europe
AP
8%
3%
4%
6%
24%
23%
19%
15%
1%
0%
2%
1%
36%
33%
34%
34%
20%
34%
27%
31%
11%
5%
13%
12%
Source: The Seagate Rethink Data Survey, IDC, 2020
Percentage of Potentially Available
Data Exploited
FIGURE 22
Source: The Seagate Rethink Data Survey, IDC, 2020
Main Challenges in Exploiting Data’s Potential
FIGURE 23

RETHINK DATA: PUT MORE OF YOUR BUSINESS DATA TO WORK—FROM EDGE TO CLOUD | 56 |
seagate.com
© 2020 Seagate Technology LLC. All rights reserved. Seagate, Seagate Technology, and the Spiral logo are registered trademarks of Seagate Technology
LLC in the United States and/or other countries. All other trademarks or registered trademarks are the property of their respective owners. Seagate reserves
the right to change, without notice, product offerings or specications. SC738.1-2006, July 2020
