Photo: VHB
Guide for Improving
Pedestrian Safety
at Uncontrolled
Crossing Locations
July 2018, Updated
NOTICE
This document is disseminated under the sponsorship of the U.S. Department of
Transportation in the interest of information exchange. The U.S. Government assumes no
liability for the use of the information contained in this document. This report does not
constitute a standard, specification, or regulation.
The U.S. Government does not endorse products or manufacturers. Trademarks or
manufacturers’ names appear in this report only because they are considered essential to the
objective of the document.

Technical Report Documentation Page
1. REPORT NO.
FHWA-SA-17-072
2. GOVERNMENT ACCESSION NO. 3. RECIPIENT'S CATALOG NO.
4. TITLE AND SUBTITLE
Guide for Improving Pedestrian Safety at Uncontrolled Crossing Locations
5. REPORT DATE
January 2018 (July 2018, Updated)
6. PERFORMING ORGANIZATION
CODE
7. AUTHOR(S)
Lauren Blackburn (VHB), Charles Zegeer (HSRC), and Kristen Brookshire (HSRC)
8. PERFORMING ORGANIZATION
REPORT NO.
9. PERFORMING ORGANIZATION NAME & ADDRESS 10. WORK UNIT NO.
11. CONTRACT OR GRANT NO.
DTFH61-16-D-00005
VHB
8300 Boone Boulevard, Suite 300
Vienna, VA 22182
The University of North Carolina at
Chapel Hill
Highway Safety Research Center (HSRC)
104 Airport Drive, Suite 2200
Chapel Hill, NC 27599-1350
12. SPONSORING AGENCY NAME AND ADDRESS
Federal Highway Administration Office of Safety
1200 New Jersey Ave., SE
Washington, DC 20590
13. TYPE OF REPORT AND PERIOD
14. SPONSORING AGENCY CODE
FHWA
15. SUPPLEMENTARY NOTES
The Task Order Contracting Officer's Representative (TOCOR) for this task was Rebecca Crowe.
16. ABSTRACT
This guide assists State or local transportation or traffic safety departments that are considering developing a policy
or guide to support the installation of countermeasures at uncontrolled pedestrian crossing locations. This document
provides guidance to agencies, including best practices for each step involved in selecting countermeasures. By focusing
on uncontrolled crossing locations, agencies can address a significant national safety problem and improve quality of life
for pedestrians of all ages and abilities. Agencies may use this guide to develop a customized policy or to supplement
existing local decision-making guidelines.
The January 2018 version of this guide was updated to include the Rectangular Rapid-Flashing Beacon (RRFB). FHWA
issued a new Interim Approval (IA-21) for the optional use of RRFBs in March 2018.
17. KEY WORDS
pedestrian crash countermeasures, uncontrolled crossings, midblock crossings,
Pedestrian Hybrid Beacon, Road Diet, crosswalk visibility enhancements,
pedestrian refuge island, raised crosswalk, Rectangular Rapid-Flashing Beacon
18. DISTRIBUTION STATEMENT
No restrictions.
19. SECURITY CLASSIF. (OF THIS
REPORT)
Unclassified
20. SECURITY CLASSIF. (OF THIS
PAGE)
Unclassified
21. NO. OF PAGES
38
22. PRICE
Form DOT F 1700.7 (8-72) Reproduction of completed page authorized.
ii
Guide for Improving Pedestrian Safety at Uncontrolled Crossing Locations
What is the
Guide for Improving Pedestrian Safety at Uncontrolled Crossing Locations
?
State or local transportation or traffic safety departments should consider developing a policy or guide to support the
installation of countermeasures at uncontrolled pedestrian crossing locations. This document provides guidance to
agencies, including best practices for each step involved in selecting countermeasures. Agencies may use this guide
to develop a customized policy or to supplement existing local decision-making guidelines.
This document was produced by the Federal Highway Administration (FHWA) as part of the Safe Transportation for
Every Pedestrian (STEP) program. STEP is part of the fourth round of Every Day Counts. STEP's purpose is to help
transportation agencies address crashes by promoting countermeasures with known safety benefits at uncontrolled
crossing locations.
Uncontrolled pedestrian crossing locations occur where sidewalks or designated walkways intersect a roadway at
a location where no traffic control (i.e. traffic signal or STOP sign) is present. These common crossing types occur at
intersections (where they may be marked or unmarked) and at non-intersection or midblock locations (where they must
be marked as crossings). Overall, uncontrolled pedestrian crossing locations correspond to higher pedestrian crash
rates, often due to inadequate pedestrian crossing accommodations.
By focusing on uncontrolled crossing locations, local and State agencies can address a significant national safety
problem and improve quality of life for pedestrians of all ages and abilities. STEP promotes the following six effective
and lower-cost countermeasures that communities can deploy based on their specific needs:
» Crosswalk visibility enhancements (i.e., high-visibility crosswalk markings, parking restriction on crosswalk
approach, improved lighting, advance Yield Here To [Stop Here For] Pedestrians sign and yield [stop] line, In-
Street Pedestrian Crossing sign, and curb extension).
» Raised crosswalk.
» Pedestrian refuge island.
» Pedestrian Hybrid Beacon (PHB).
» Road Diet.
» Rectangular Rapid-Flashing Beacon (RRFB).
These countermeasures and their safety benefits are described further in this guide. The guide also includes best
practices for identifying locations and installing countermeasures at uncontrolled pedestrian crossing locations.
iii
Guide for Improving Pedestrian Safety at Uncontrolled Crossing Locations
Table of Contents
Introduction ..........................................................................................1
1. Collect Data and Engage the Public ............................................3
2. Inventory Conditions and Prioritize Locations ..............................8
3. Analyze Crash Types and Safety Issues ......................................12
4. Select Countermeasure(s) ............................................................15
5. Consult Design and Installation Resources ................................23
6. Identify Opportunities and Monitor Outcomes ..........................24
Glossary ...............................................................................................27
Appendix A: Framework for a Resolution Supporting Pedestrian
Safety ...................................................................................................29
Appendix B: CRF and CMF Summary Table ....................................32
iv
Guide for Improving Pedestrian Safety at Uncontrolled Crossing Locations
List of Figures
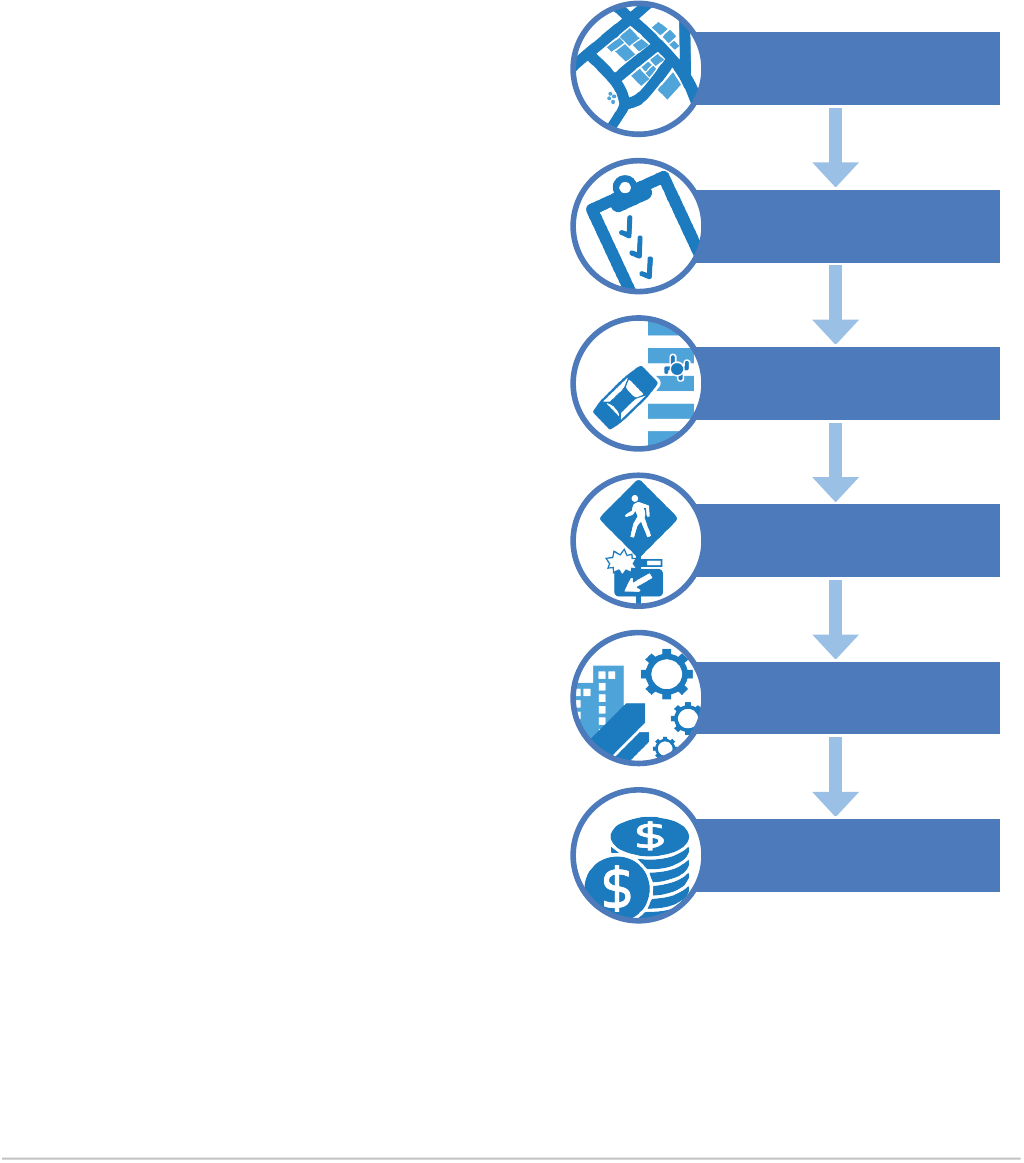
Figure 1. Process diagram for selecting countermeasures at
uncontrolled pedestrian crossing locations. ................................... 1
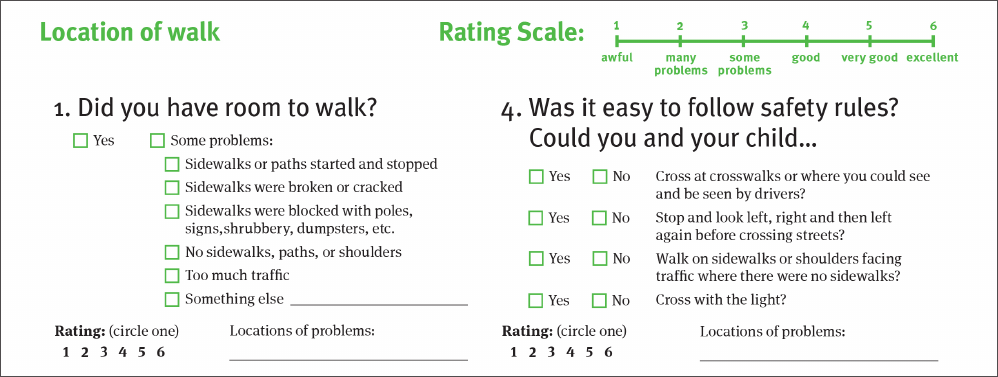
Figure 2. Excerpt from "Walkability Checklist." ............................... 5
Figure 3. Example crossing inventory worksheet. ........................... 9
Figure 4. Crash cluster analysis map: Richmond, VA................... 11
Figure 5. Pedestrian collision summary. ......................................... 13
Figure 6. Rendering of a PHB. ......................................................... 20
List of Tables
Table 1. Application of pedestrian crash countermeasures by
roadway feature.................................................................................16
Table 2. Safety issues addressed per countermeasure. ...............17
Table 3. CRFs and CMFs by countermeasure. ................................ 32
v
Guide for Improving Pedestrian Safety at Uncontrolled Crossing Locations
List of Abbreviations
AADT annual average daily traffic
AASHTO American Association of State Highway and
Transportation Officials
ADA Americans with Disabilities Act
ADT average daily traffic
CMF crash modification factor
CRF crash reduction factor
EDC Every Day Counts
FARS Fatality Analysis Reporting System
FHWA Federal Highway Administration
GHSA Governors Highway Safety Association
GIS geographic information system
HSIP Highway Safety Improvement Program
HSP Highway Safety Plan
MUTCD Manual on Uniform Traffic Control Devices
NHTSA National Highway Traffic Safety Administration
PHB Pedestrian Hybrid Beacon
RRFB Rectangular Rapid-Flashing Beacon
RSA Road Safety Audit
SHSP Strategic Highway Safety Plan
STBG Surface Transportation Block Grant
STEP Safe Transportation for Every Pedestrian
TZD Toward Zero Deaths
VZ Vision Zero
1
Guide for Improving Pedestrian Safety at Uncontrolled Crossing Locations
Introduction
Introduction
Pedestrians are among the most vulnerable
road users, accounting for approximately 16
percent of all roadway fatalities nationally in
2016, per the Fatality Analysis Reporting System
(FARS).
1
Pedestrians are especially vulnerable
at non-intersection locations, where 72 percent
of pedestrian fatalities occur.
1
This guide addresses safety issues at
uncontrolled pedestrian crossing locations,
which occur where sidewalks or designated
walkways intersect a roadway at a location
where no traffic control (i.e., traffic signal
or STOP sign) is present. These common
crossing types occur at intersections (where
they may be marked or unmarked) and
at non-intersection or midblock locations
(where they must be marked as crossings).
Overall, uncontrolled pedestrian crossing
locations correspond to higher pedestrian
crash rates than controlled locations, often
due to inadequate pedestrian crossing
accommodations.
How to Use this Guide
The guide includes steps to assist an agency
in selecting appropriate countermeasures
to help improve pedestrian safety, as
illustrated in Figure 1. An agency that has
an established process for identifying
priority locations for pedestrian safety
improvements should review the guidance
in Steps 3 through 6. This information is most
important for selecting pedestrian crossing
countermeasures. An agency that is at
the beginning stages of identifying priority
locations should consult each of the steps
described in this guide.
1
NHSTA, “FARS Data Query: 2016 Data.” Fatality Analysis Reporting System (FARS) Encyclopedia. (2017). https://www-fars.nhtsa.dot.gov//QueryTool/QuerySection/
SelectYear.aspx
1
Collect data and
engage the public
2
Inventory conditions
and prioritize locations
3
Analyze crash types
and safety issues
6
Identify opportunities
and monitor outcomes
5
Consult design and
installation resources
4
Select countermeasures
Figure 1. Process diagram for selecting
countermeasures at uncontrolled pedestrian
crossing locations.

2
Guide for Improving Pedestrian Safety at Uncontrolled Crossing Locations
Introduction
Following the process in the guide results
in possible countermeasure options based
on road conditions, crash causes, and
pedestrian safety issues. The guide provides
two reference tables to help identify
countermeasure options. Table 1 identifies
countermeasures by roadway conditions
such as vehicle speed limit, annual average
daily traffic (AADT), and number of travel
lanes. Table 2 helps further pinpoint the most
appropriate countermeasures by common
safety concerns such as failure to yield or
excessive vehicle speeds. The guide does
not include specific recommendations for
countermeasures based on all criteria in
design and reference manuals, such as
actual speeds and pedestrian volumes.
The agency should reference the Manual
on Uniform Traffic Control Devices (MUTCD),
American Association of State Highway and
Transportation Officials (AASHTO) design
guidelines, and State and local practices
when selecting one or more specific
countermeasures. The guide is followed by
appendices including reference material for
a local agency resolution and a summary of
research cited for crash modification factors
(CMFs).
The agency should note additional
considerations for the application of this
guide, such as costs to design, install, and
maintain the treatments. The agency should
apply engineering judgment and conduct
field investigations to confirm data and
observe driver and pedestrian behaviors
when selecting countermeasures.
Building a safe and connected pedestrian
network requires consideration of topics
beyond what is included in this guide.
This guide does not include methods for
prioritizing sidewalk improvements, but
agencies should consider giving special
attention to connecting the pedestrian
network with sidewalks, walkways, paved
shoulders, and trails and paths. The
ActiveTrans Priority Tool was created through
the National Cooperative Highway Research
Program and can provide agencies with
automated resources to prioritize pedestrian
and bicycle improvements.
Pedestrian crossings in or near school zones
are not specifically addressed in this guide,
as these crossings may be subject to other
guidance or other considerations. Agencies
may refer to the "Safe Routes to School
Briefing Sheets: School Area Traffic Control"
produced by the Institute of Transportation
Engineers (ITE) for guidance on improving
pedestrian crossings near schools.
This guide does not describe pedestrian
crossing requirements per the Americans
with Disabilities Act (ADA), although ADA
requirements should be addressed as part
of any pedestrian crossing improvements
project. For more information about ADA
accessibility requirements, the agency
should consult the US Access Board's 1991
ADA Accessibility Guidelines (ADAAG), the
2010 Standards for Accessible Design, and
the 2011 Proposed Accessibility Guidelines for
Pedestrian Facilities in the Public Right-of-Way
(proposed PROWAG).

Collect Data and Engage the Public
3
Guide for Improving Pedestrian Safety at Uncontrolled Crossing Locations
GUIDING PRINCIPLES
This section describes optional methods for describing existing pedestrian safety trends and engaging stakeholders.
The following are important considerations for this step in the process of selecting countermeasures:
» Review existing plans for safety statistics and locations previously identified for safety improvements.
» Develop a resolution or policy statement in support of improving pedestrian safety at uncontrolled crossing locations.
» If a formal process is preferred, initiate a Pedestrian Safety Action Plan to engage the community and identify
priority locations.
» If a less formal process is preferred, document public comments previously received or conduct a walkability audit
to identify locations generally considered as less safe for pedestrians crossing.
Collect Pedestrian Crash and
Safety Data
Crash reports completed by law
enforcement agencies may include
information about driver and pedestrian
actions, as well as environmental conditions
when and where the crash occurred. These
data are helpful to understand safety issues
in the area. Crash data may be geocoded
and mapped. The agency can collect crash
maps, request crash reports (as needed),
and contact public health officials for other
pedestrian injury data.
Review Existing Traffic Safety Plans
The Strategic Highway Safety Plan (SHSP)
is a statewide-coordinated, data-driven
safety plan that provides a comprehensive
framework for reducing highway fatalities
and serious injuries on all public roads.
States are required to update the SHSP at
least once every five years. The SHSP may
include an emphasis area and strategies
for improving pedestrian safety. The agency
should review the SHSP for pedestrian crash
statistics and strategies for pedestrian safety
improvements.
The SHSP informs the State's Highway Safety
Improvement Program (HSIP). The HSIP is a
program of highway safety improvement
1
Collect Data and
Engage the Public
4
Guide for Improving Pedestrian Safety at Uncontrolled Crossing Locations
Collect Data and Engage the Public
projects, activities, plans and reports. HSIP
projects are selected through a data-driven
approach and can include pedestrian
crash countermeasures and intersection
improvements. Some States set aside HSIP
funding for pedestrian safety improvements,
while other States use a common scoring
process to consider safety projects for all
travel modes. The agency should identify
and understand pedestrian safety projects
in the current HSIP, and consider how
pedestrian safety projects are identified
for potential funding and implementation.
The Safety Performance Management
Measures Final Rule (23 CFR 490) establishes
requirements that support the HSIP,
including a measure for the number of
non-motorized fatalities and non-motorized
serious injuries. This performance measure
includes both pedestrians and bicyclists.
The State’s Highway Safety Plan (HSP)
must also be coordinated with the SHSP.
The HSP is an annual strategy submitted
by the State’s Governor’s Highway Safety
Office to the National Highway Traffic Safety
Administration (NHTSA). The HSP focuses on
countermeasures that address driver and
non-motorized behavior, and it provides
an investment plan for activities such as
law enforcement operations and public
education programs. The HSP includes
performance measures established by
NHTSA and the Governors Highway Safety
Association (GHSA), including one for
pedestrian fatalities. Pedestrian safety
initiatives are eligible for funding through the
HSP. The agency should research pedestrian
safety programs recommended in the HSP
and consider how pedestrian crossing
treatments can support the performance
standards described in the HSP.
Evaluate Pedestrian
Accommodation and Traffic
Safety Policies
The agency may have a policy or guidance
for how pedestrian improvements are
incorporated into other roadway projects,
such as a Complete Streets policy. The
policy explains the process for integrating
sidewalks and crossing treatments into
routine street maintenance activities and
large-scale highway projects. The agency
should examine the linkages between
Complete Streets and pedestrian safety
and consider improvements to the process
to better integrate pedestrian crossing
improvements into roadway projects.
The agency may have adopted a policy
for eliminating traffic-related fatalities, such
as a Vision Zero or Toward Zero Deaths
initiative. The programs focus on eliminating
or significantly reducing traffic fatalities and
prioritize strategies for the most vulnerable
roadway users, such as pedestrians. These
programs may summarize how all agency
departments can improve pedestrian and
traffic safety, and may include metrics that
establish the need for safety at uncontrolled
pedestrian crossings.
Review Pedestrian Master Plans
for Proposed Projects
Another approach to identify pedestrian
issues is to review existing local or regional
plans, particularly those with a focus on
pedestrians, for potential locations for
safety projects and to identify needed
countermeasures. A State or local
pedestrian master plan may include
recommendations for pedestrian
safety projects, identified infrastructure
deficiencies, and/or documentation
5
Guide for Improving Pedestrian Safety at Uncontrolled Crossing Locations
Collect Data and Engage the Public
about safety concerns. This step leverages
prior analyses and helps to identify
countermeasures that that the agency is
already considering.
Initiate a Pedestrian Safety Action
Plan (PSAP)
Agency leaders and community stakeholders
can begin a formal process to identify priority
locations and key strategies for improving
pedestrian safety. The agency may initiate a
PSAP to increase community awareness and
support for improving pedestrian safety. A
PSAP considers the input of stakeholders from
multiple disciplines and uses data analysis
to identify potential locations for safety
improvement.
Document Informal Public
Comments
The agency can identify locations of
significance within a jurisdiction by
collecting concerns and requests from
community partners. Agencies should set
up a process for receiving, tracking, and
responding to input from residents and
visitors. Many local governments respond
with traffic calming request applications
or online forms for residents with concerns
about pedestrian safety on high-speed
arterials or collector streets. Agencies may
also consider forming a committee or work
group devoted to considering pedestrian
safety and mobility, such as a pedestrian
advisory committee. This type of group can
collect input from stakeholders and present
their concerns to agency staff or decision-
makers.
Conduct a Walkability Audit
Community leaders and neighbors can
conduct a walkability audit at priority
locations or corridors to identify deficiencies
in the pedestrian network at a small area
or neighborhood scale. This is an informal
method for engaging stakeholders and
raising awareness about pedestrian safety.
Leaders can organize an event and ask
participants to follow a simple checklist
to assess neighborhood streets. Figure 2
shows an excerpt from a sample "walkability
checklist" that agencies may use to conduct
a walkability audit.
Figure 2. Excerpt from "Walkability Checklist."
Source: Pedestrian and Bicycle Information Center. Created in collaboration with FHWA, NHTSA, National Center for Safe
Routes to School, and United States Environmental Protection Agency.

6
Guide for Improving Pedestrian Safety at Uncontrolled Crossing Locations
Collect Data and Engage the Public
RESOURCES
NHTSA Pedestrian Safety Information
NHTSA publishes annual reports summarizing
the latest pedestrian fatality statistics. These
statistics are based on FARS and the reports
describe pedestrian fatality trends per different
socioeconomic groups and for each State.
Smart Growth America – National Complete
Streets Coalition
Smart Growth America, a non-governmental
advocacy organization, supports the National
Complete Streets Coalition. This organization
provides resources to support the development and
implementation of Complete Streets policies. These
policies encourage pedestrian mobility and safety
by promoting street design that accommodates
controlled and uncontrolled crossings. For example,
the Massachusetts Department of Transportation
Complete Streets program assists local
governments developing Complete Streets policies
and implementation plans.
FHWA State SHSP Resources
The FHWA Office of Safety posts a link to each
State’s current SHSP. This website also lists
noteworthy practices. Many SHSP plans provide
an emphasis on pedestrians and contain goals for
reducing traffic fatalities and injuries.
The Ohio DOT 2015 SHSP has a pedestrian
emphasis area that seeks to reduce fatalities
and serious injuries through six strategies
that include data collection, institutionalizing
pedestrian accommodations, implementing proven
countermeasures, and promoting law enforcement.
FHWA HSIP Resources
The HSIP includes the projects selected for
implementation, an evaluation of past projects,
and an annual status report. Projects can include
pedestrian safety improvement programs and
projects. For example, the 2016 Oregon HSIP
Annual Report details how the its All Roads
Transportation Safety Program sets aside funding to
address systemic pedestrian crash locations.
State HSP Documents
NHTSA posts the States’ current HSP outlining
non-infrastructure strategies for improving
roadway safety. A State HSP is likely to contain a
pedestrian fatality and injury reduction goal, an
associated performance measure, and describe
non-infrastructure initiatives like enforcement and
education programs. For example, Colorado DOT's
2017 HSP (called the 2017 Integrated Safety Plan)
supports the Denver Police Department’s “Decoy
Pedestrian Program” to enforce driver yielding
compliance at high-crash pedestrian crossings.
Vision Zero Network
This collaborative website posts case studies
and tracks cities who are implementing Vision
Zero plans or goals. The Vision Zero Network
website also notes best practices by agencies
who are working to eliminate traffic fatalities
and serious injuries. Vision Zero goals are
accompanied by policies, strategies, and target
dates. For example, Columbia, Missouri’s Vision
Zero Action Plan contains an outreach campaign
to educate pedestrians and drivers on new and
potentially confusing infrastructure improvements
like pedestrian hybrid beacons and enhanced
pedestrian crosswalks.

7
Guide for Improving Pedestrian Safety at Uncontrolled Crossing Locations
Collect Data and Engage the Public
FHWA How to Develop a Pedestrian and Bicycle
Safety Action Plan (2017)
This document explains the process of developing
pedestrian and bicycle safety action plans. The
sources of data required for these plans may include
police reports, roadway and intersection conditions,
field visits of crash sites. For example, New Jersey’s
PSAP identified how its infrastructure prioritization
programs could be revised to recognize locations
with systemic pedestrian crash risk.
FHWA Achieving Multimodal Networks: Applying
Design Flexibility and Reducing Conflicts (2016)
This resource focuses on flexibility and options
for the design of pedestrian and bicycle networks
designed to minimize crash conflicts, including
case studies to illustrate various design treatments.
Walkability Checklist
This tool can be used by community leaders
during a walkability audit to evaluate pedestrian
infrastructure and traffic behavior.

Inventory Conditions and Prioritize Locations
8
Guide for Improving Pedestrian Safety at Uncontrolled Crossing Locations
GUIDING PRINCIPLES
This section describes how the agency can document field conditions (such as roadway characteristics) necessary for
prioritizing locations and selecting countermeasures. The following are important considerations for this step:
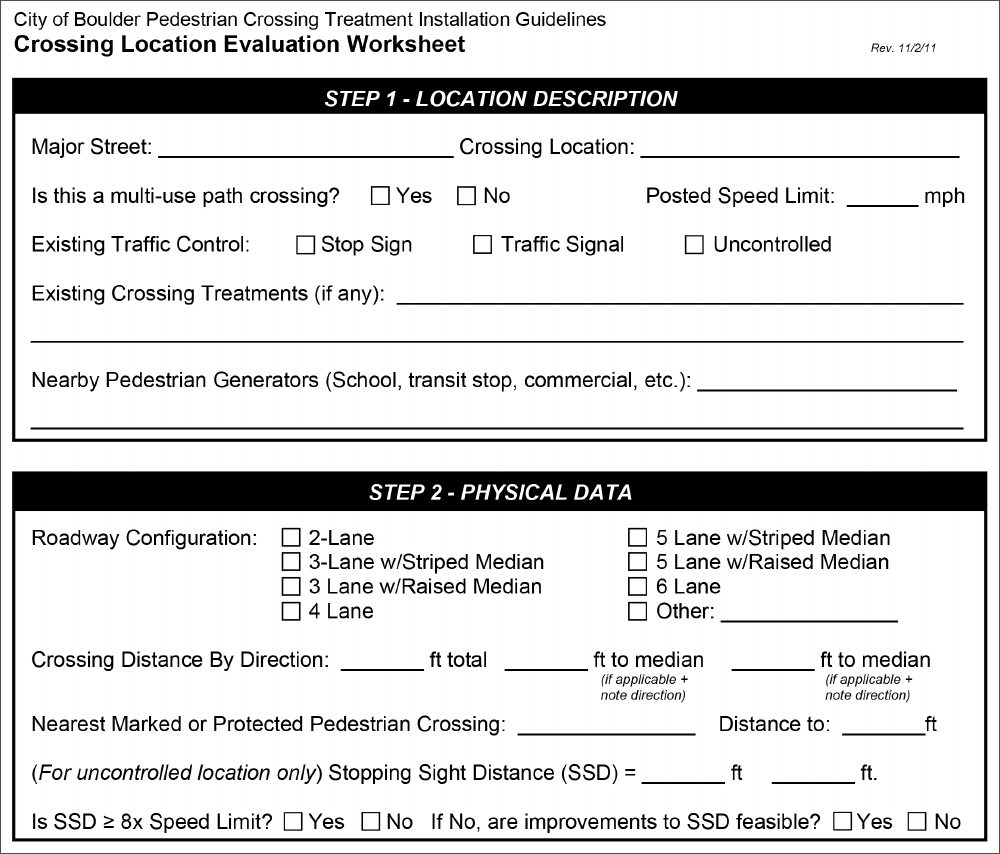
» Create a worksheet or checklist of roadway characteristics to record in the field (see Figure 3).
» Document pedestrian volumes and driver behavior, especially where pedestrians are frequently expected such as at
bus stop locations and near schools.
» Classify pedestrian crossings as either uncontrolled or controlled locations.
» Analyze data and create maps to show priority locations for pedestrian improvements.
Inventory Roadway Characteristics
The process of collecting roadway
characteristics includes compiling
geospatial data to create base maps
for each of the priority sites. Roadway
conditions are key criteria for selecting
countermeasures. The agency may
document and map the following roadway
characteristics for priority sites (see Glossary
for more information):
» Speeds, including posted speed limits and
actual speeds (i.e., 85th percentile speeds).
» Number of travel lanes for each approach.
» Center turn lanes, medians, or refuge islands.
» Intersection turn lanes.
» Vehicle queue lengths at intersections.
» Width of roadway, from curb to curb.
» Traffic volumes (AADT or ADT).
» Large truck traffic volumes or large trucks
as a percentage of total traffic.
» On-street parking, alignment, and marked
or signed restrictions.
2
Inventory Conditions
and Prioritize Locations
9
Guide for Improving Pedestrian Safety at Uncontrolled Crossing Locations
Inventory Conditions and Prioritize Locations
Figure 3. Example crossing inventory worksheet.
Source: City of Boulder, Pedestrian Crossing Treatment Installation Guidelines (2011).
10
Guide for Improving Pedestrian Safety at Uncontrolled Crossing Locations
Inventory Conditions and Prioritize Locations
Inventory Pedestrian Crossings
and Observed Traffic Behavior
The agency can also document pedestrian
crossing conditions. Agency staff can visit
the sites and record the following crossing
site features:
» Crosswalk markings, presence, and types.
» Crosswalk distance (in feet) and crossing
phase duration (in seconds).
» Signage, such as advance, crosswalk, and
in-street.
» Traffic control devices and signals, such
as pedestrian crossing signal, pedestrian
signal detector, STOP sign, RRFB, and PHB.
» Signal phasing and restrictions, such
as Leading Pedestrian Interval, split
or concurrent phasing type, and turn
restrictions.
» Vertical elements, such as refuge island or
raised crosswalk.
» Horizontal elements, such as curb
extensions, narrowed curb radii, Road Diet,
or lane reconfiguration.
» Accessibility features, such as curb ramps,
truncated domes, and accessible signal
push buttons.
» Lighting and visibility enhancements, such
as overhead lighting.
» Pedestrian volumes, including transit
boarding volumes from nearby stops.
» Pedestrian crossing behaviors near
important activity centers such as transit
stops, schools, and in downtown districts.
» Driver behaviors at crosswalks and
intersections.
» Sight distance and visual clearance of
crossing.
Classify Pedestrian Crossings as
Controlled or Uncontrolled
In addition to collecting inventory information
about the priority sites, it is important that the
agency categorize each crossing as either
controlled or uncontrolled. Uncontrolled
pedestrian crossing locations occur where
sidewalks or designated walkways intersect
a roadway at a location where no traffic
control (i.e., traffic signal or STOP sign) is
present. These common crossing types occur
at intersections (where they may be marked
or unmarked) and at non-intersection or
midblock locations (where they must be
marked as crossings). This guide describes
countermeasures applicable to uncontrolled
crossings. Some of these countermeasures
can also be used for controlled crossings,
and the agency should consult other
guidance for specific implementation
criteria at those sites.
Screen the Network for High-
Crash or High-Risk Locations
By following a data-driven approach, the
agency can readily explain and defend
how it selected priority sites for improvement.
An agency can study, or screen, the safety
conditions for the road network within its
jurisdiction. The screening process uses
geo-coded pedestrian crash data and
other information to identify different types
of locations. Network screening may take
the form of spot safety or systemic safety
analysis. Spot safety analysis is based on
crash history at individual locations and
identified high-crash locations. The systemic
approach analyzes crash history on an
aggregate basis to identify roadways that
have high-crash experience, as well as
high-risk characteristics at other sites before
crashes occur, so countermeasures can be
selected to address these characteristics.
11
Guide for Improving Pedestrian Safety at Uncontrolled Crossing Locations
Inventory Conditions and Prioritize Locations
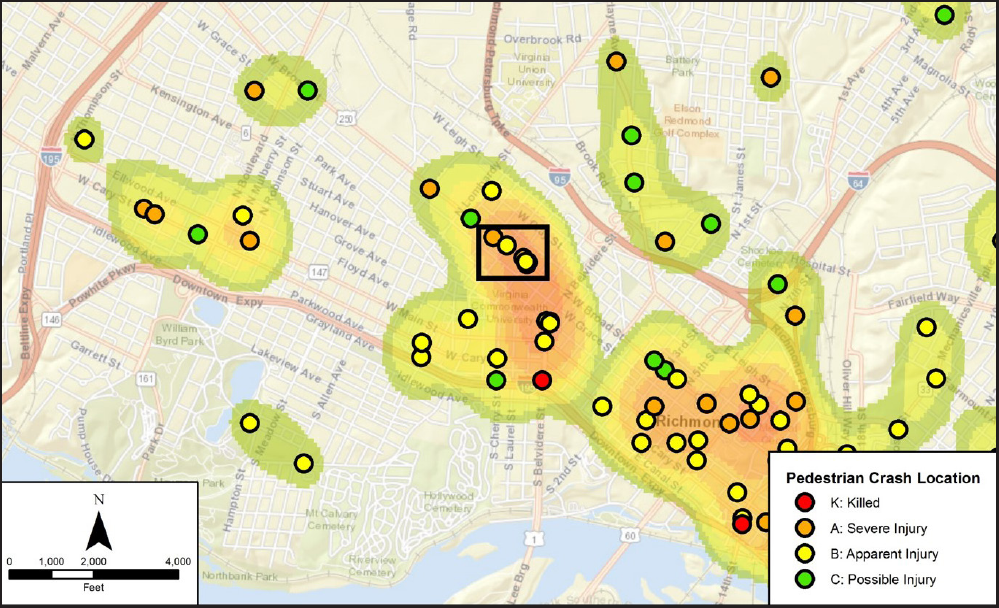
Analyze “Hot Spots” or Crash Cluster
Locations
Spot safety analysis involves mapping
the individual locations of crashes over a
time period, preferably at least 5 years for
pedestrian crash data. Mapping these
crashes on a geographic information system
(GIS) helps to visually reveal clusters, or “hot
spots,” of pedestrian crashes. Similarly, using
the spot analysis approach may also reveal
corridors or areas where pedestrian crashes
tend to cluster. Grouping the clusters of
crashes identified in the spot location
process can show areas of potential
pedestrian improvements. These areas
may be corridors, roadways that share
roadway design features, and/or areas of
a similar land use. Figure 4 shows a map of
pedestrian crash locations in an area.
Develop a Systemic Analysis Approach
Many areas may have low pedestrian
crash rates, but still have a high risk for
pedestrian crashes. The agency can
identify these sites based on roadway
characteristics combined with land use
features of the area. The agency may select
countermeasures to address these high-risk
factors before pedestrian crashes occur.
The systemic analysis can cover different
geographies; an agency may choose to
analyze for an area of interest or the entire
jurisdiction. Systemic analysis considers
factors such as inadequate roadway
design and traffic control devices, lighting
conditions, vehicle speeds, and nearby
pedestrian destinations. Combinations of
these factors help identify countermeasures
to address and prevent pedestrian crashes.
Figure 4. Crash cluster analysis map: Richmond, VA.
Source: Virginia Department of Transportation (2017).
Analyze Crash Types and Safety Issues
12
Guide for Improving Pedestrian Safety at Uncontrolled Crossing Locations
GUIDING PRINCIPLES
This section describes methods for summarizing pedestrian crash types and observed traffic safety issues. This
information is important for selecting countermeasures. The following are important considerations for this step:
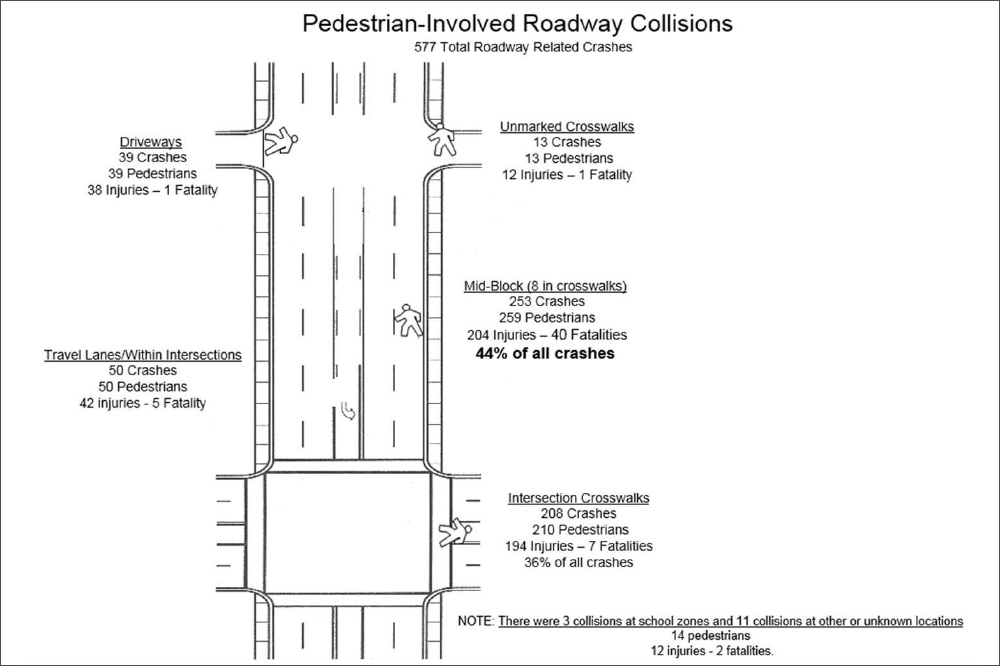
» Diagram crashes according to information included on crash reports (see Figure 5 for a sample diagram).
» Review the crash types described by the Pedestrian Safety Guide and Countermeasure Selection System (PEDSAFE).
» Conduct a pedestrian Road Safety Audit (RSA) to formally engage representatives from various departments and
interest groups.
» Lead an informal site visit to engage stakeholders and describe conditions observed in the field.
Diagram Crash Reports
Crash diagrams are created to graphically
illustrate crash data associated with a given
site. Each crash is plotted on a schematic
of the site at the approximate location
where the crash occurred. Icons are used
to represent crash types so that patterns
are identifiable. Spatial analysis tools like
GIS can also enhance the analysis. Crash
diagrams are sometimes plotted on aerial
imagery and cross referenced with a
tabular listing of the associated crash data
so that agency staff can easily access key
information. Crash diagrams are useful
when there are many crashes associated
with a site. An agency may not have
sufficient pedestrian crash history to reveal
crash patterns, but the absence of crash
data does not necessarily mean a safety
problem does not exist. In these cases, an
agency should consider systemic analysis.
Identify Crash Factors
Whether an agency is assembling the crash
diagrams or simply conducting an exercise
to identify potential factors for pedestrian
crashes in their jurisdiction, these factors
can be considered:
» Vehicle speed.
» Compliance with regulations and traffic
devices.
» Pedestrian crossing behaviors.
» Built environment or area type.
3
Analyze Crash Types
and Safety Issues
13
Guide for Improving Pedestrian Safety at Uncontrolled Crossing Locations
Analyze Crash Types and Safety Issues
» Intersection presence and types of traffic
control devices.
» Pedestrian crossing distance.
» Time of day/day of week/seasonal factors.
» Alcohol involvement by pedestrians or
drivers.
» Demographics.
» Special populations, such as school-aged
children, older adults, and persons with
disabilities.
» Presence of transit stops.
Conduct a Road Safety Audit (RSA)
An RSA is the formal safety performance
examination of an existing or future
road or intersection by an independent,
multidisciplinary team. It qualitatively estimates
and reports on potential road safety issues
and identifies opportunities for improvements
in safety for all road users. An RSA considers
all users of the roadway and human factors
and generates a formal report and response
upon its conclusion. The agency can use
the field conditions inventory and crash
type summary during the RSA process. RSAs
typically produce multiple planning-level
countermeasure recommendations for the
study corridor or area.
Figure 5. Pedestrian collision summary.
Source: City of Phoenix, AZ. 2015 Pedestrian Collision Summary (2015).
14
Guide for Improving Pedestrian Safety at Uncontrolled Crossing Locations
Analyze Crash Types and Safety Issues
Like traditional RSAs, pedestrian RSAs are
performed by a multidisciplinary team of
experts or agency representatives, use
structured prompt lists, and consider the
surrounding socioeconomic and land use
context. The materials for a pedestrian
RSA provide more detail on pedestrian
safety issues and examine elements such
as signage, obstructions, signals, bus stop
locations, drainage, and lighting. These
tools can help identify possible deficiencies
in the pedestrian network and potential
locations for further investigation.
Lead an Informal Site Visit
An alternative to a formal RSA is an on-
site evaluation of pedestrian conditions
including representatives from multiple
agency departments and stakeholder
interest groups. An informal on-site
evaluation can collect information about
pedestrian crossings and traffic operations
at the neighborhood or area-wide scale.
Law enforcement, public health, community
groups, neighborhood residents, street
or transportation departments, planning,
emergency response, schools, and public
transportation agencies can be involved in
the process. The findings from this informal
evaluation should be documented and
shared with participants.
RESOURCES
FHWA Model Road Safety Audit Policy (2014)
This resource outlines the steps typically taken to
conduct an RSA and the roles of the stakeholders.
Identifying safety issues is an element of the RSA
that is accompanied by suggestions on how to
enhance the specific road’s safety.
Pedestrian RSA Guidelines and Prompt Lists
(2007)
This resource complements practices for RSAs
with additional guidance and a field manual for a
pedestrian-focused RSA. An RSA team will use the
knowledge of a diverse team, analysis of crash data,
and a site visit to identify pedestrian safety issues.
Pedestrian RSA Case Studies (2009)
This website provides links to several examples of
RSAs focused on identifying pedestrian safety risks
and improvement strategies. For example, the City
of Tucson, Arizona conducted an RSA of roadways
with PHBs to improve the countermeasures’ visibility
and usability.
PEDSAFE: Pedestrian Crash Typing
PEDSAFE provides definitions for 12 key pedestrian
crash types identified by the software package, the
Pedestrian and Bicycle Crash Analysis Tool (PBCAT).
PBCAT is still used by many agencies but may not be
compatible with some current operating systems.
Select Countermeasure(s)
15
Guide for Improving Pedestrian Safety at Uncontrolled Crossing Locations
GUIDING PRINCIPLES
This section can help the agency select countermeasures based on information previously collected and assessed.
The agency can use the following resources to select countermeasures:
» First, reference Table 1 to compare roadway and vehicle speed characteristics to countermeasure options.
» Then, reference Table 2 to compare crash types and other observed safety issues to countermeasure options.
» Review Appendix B for more information about countermeasure CRFs and CMFs.
Application of Countermeasures
by Roadway Feature
Table 1 includes a comprehensive
matrix and list of STEP pedestrian crash
countermeasures suggested for application
at uncontrolled crossing locations
per roadway and traffic features. The
countermeasures are assigned to specific
matrix cells based on safety research,
best practices, and established national
guidelines. When a pedestrian crossing is
established, the agency should review the
countermeasure options in the cells before
selecting the optimal group of crossing
treatments. The agency should consider
the previously obtained characteristics
such as pedestrian volume, operational
speeds, land use context, and other site
features when selecting countermeasures.
The agency should also reference the
MUTCD and other national, State, and local
guidelines when making the final selection
of countermeasures.
For example, the agency may evaluate a
5-lane road with no raised median, an AADT
of 12,000, and a 35 mph posted speed
limit. The matrix recommends the agency
strongly consider high-visibility crosswalks,
adequate lighting, and parking restrictions
on the approaches. In addition, the agency
should strongly consider adding advance
Yield Here To (Stop Here For) Pedestrians
signs and yield (stop) lines, pedestrian
refuge islands, and PHBs. Other candidate
treatments include implementing a Road
Diet along the corridor and adding curb
extensions.
4
Select Countermeasure(s)
16
Guide for Improving Pedestrian Safety at Uncontrolled Crossing Locations
Select Countermeasure(s)
Table 1 provides initial countermeasure
options for various roadway conditions. Each
matrix cell indicates possibilities that may
be appropriate for designated pedestrian
crossings. Not all of the countermeasures
listed in the matrix cell should necessarily be
installed at a crossing.
For multi-lane roadway crossings with
vehicle AADTs exceeding 10,000, a marked
crosswalk alone is typically insufficient
(Zegeer, 2005). Under such conditions, more
substantial crossing improvements (such as
the refuge island, PHB, and RRFB) are also
needed to prevent an increase in pedestrian
crash potential.
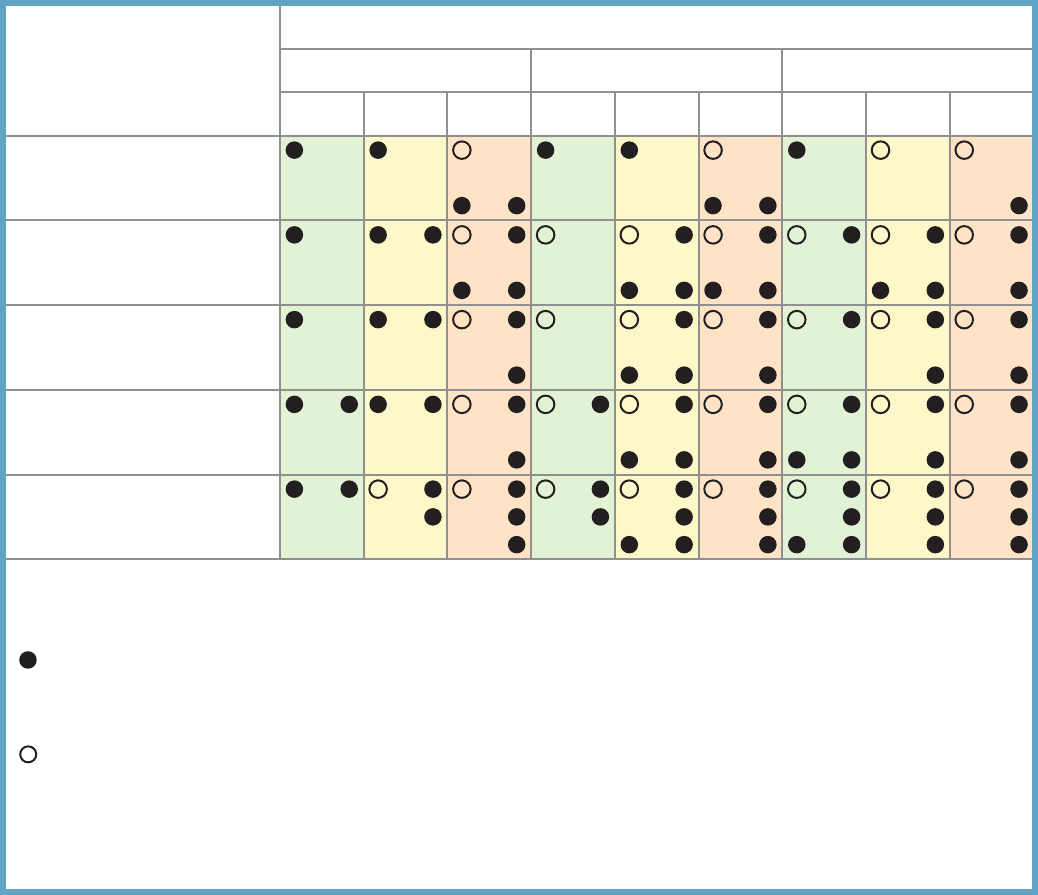
Roadway Configuration
Posted Speed Limit and AADT
Vehicle AADT <9,000 Vehicle AADT 9,000–15,000 Vehicle AADT >15,000
≤30 mph 35 mph ≥40 mph ≤30 mph 35 mph ≥40 mph ≤30 mph 35 mph ≥40 mph
2 lanes
(1 lane in each direction)
1
2
1
1
1
1
1
1
1
1
4 5 6 5 6 5 6 4 5 6 5 6 5 6 4 5 6 5 6 5 6
7 9
7 9
7 9
7 9
7 9 7 9
9
3 lanes with raised median
(1 lane in each direction)
1
2 3
1
3
1 3
1
3
1
3
1
3
1
3
1 3
1 3
4 5 5 5 4 5 5 5 4 5 5 5
7 9
7 9
7 9
7 9 7 9
7 9
7 9 9
3 lanes w/o raised median
(1 lane in each direction with a
two-way left-turn lane)
1
2 3
1
3
1
3
1
3
1
3 1
3
1
3
1
3
1
3
4 5 6 5 6 5 6 4 5 6 5 6 5 6 4 5 6 5 6 5 6
7 9 7 9
9
7 9
7 9 9
7 9
9 9
4+ lanes with raised median
(2 or more lanes in each direction)
1 3 1
3
1
3
1
3 1 3
1
3
1
3 1
3
1
3
5 5 5 5 5 5 5 5 5
7 8 9 7 8 9 8
9
7 8 9
7
8
9
8
9 7
8
9
8
9
8
9
4+ lanes w/o raised median
(2 or more lanes in each direction)
1
3 1
3 1 3 1
3 1 3 1 3 1
3 1 3 1 3
5 6 5
6
5
6
5
6
5
6
5
6
5
6
5
6
5
6
7 8 9 7 8 9 8
9
7 8 9
7
8
9
8
9 7
8
9
8
9
8
9
Given the set of conditions in a cell,
# Signifies that the countermeasure is a candidate
treatment at a marked uncontrolled crossing location.
Signifies that the countermeasure should always be
considered, but not mandated or required, based upon
engineering judgment at a marked uncontrolled
crossing location.
Signifies that crosswalk visibility enhancements should
always occur in conjunction with other identified
countermeasures.*
The absence of a number signifies that the countermeasure
is generally not an appropriate treatment, but exceptions may
be considered following engineering judgment.
1 High-visibility crosswalk markings, parking restrictions on
crosswalk approach, adequate nighttime lighting levels,
and crossing warning signs
2 Raised crosswalk
3 Advance Yield Here To (Stop Here For) Pedestrians sign
and yield (stop) line
4 In-Street Pedestrian Crossing sign
5 Curb extension
6 Pedestrian refuge island
7 Rectangular Rapid-Flashing Beacon (RRFB)**
8 Road Diet
9 Pedestrian Hybrid Beacon (PHB)**
Table 1. Application of pedestrian crash countermeasures by roadway feature.
*Refer to Chapter 4, 'Using Table 1 and Table 2 to Select Countermeasures,' for more information about using multiple countermeasures.
**It should be noted that the PHB and RRFB are not both installed at the same crossing location.
This table was developed using information from: Zegeer, C.V., J.R. Stewart, H.H. Huang, P.A. Lagerwey, J. Feaganes, and B.J. Campbell. (2005). Safety effects of marked versus unmarked
crosswalks at uncontrolled locations: Final report and recommended guidelines. FHWA, No. FHWA-HRT-04-100, Washington, D.C.; FHWA. Manual on Uniform Traffic Control Devices, 2009 Edition.
(revised 2012). Chapter 4F, Pedestrian Hybrid Beacons. FHWA, Washington, D.C.; FHWA. Crash Modification Factors (CMF) Clearinghouse. http://www.cmfclearinghouse.org/; FHWA. Pedestrian
Safety Guide and Countermeasure Selection System (PEDSAFE). http://www.pedbikesafe.org/PEDSAFE/; Zegeer, C., R. Srinivasan, B. Lan, D. Carter, S. Smith, C. Sundstrom, N.J. Thirsk, J. Zegeer,
C. Lyon, E. Ferguson, and R. Van Houten. (2017). NCHRP Report 841: Development of Crash Modification Factors for Uncontrolled Pedestrian Crossing Treatments. Transportation Research Board,
Washington, D.C.; Thomas, Thirsk, and Zegeer. (2016). NCHRP Synthesis 498: Application of Pedestrian Crossing Treatments for Streets and Highways. Transportation Research Board, Washington,
D.C.; and personal interviews with selected pedestrian safety practitioners.
17
Guide for Improving Pedestrian Safety at Uncontrolled Crossing Locations
Select Countermeasure(s)
Safety Issues Addressed per
Countermeasure
The results of the crash analysis, road safety
audit, and/or stakeholder input provide
the agency with a better understanding
of the risk factors at uncontrolled crossing
locations. The countermeasures listed
in this guide can improve the visibility of
crossing locations and reduce crashes,
and they each address at least one
additional safety concern associated with
a higher risk of collision and/or severe
injury. These additional safety issues include
the following: excessive vehicle speed,
inadequate conspicuity/visibility, drivers not
yielding to pedestrians in crosswalks, and
insufficient separation from traffic.
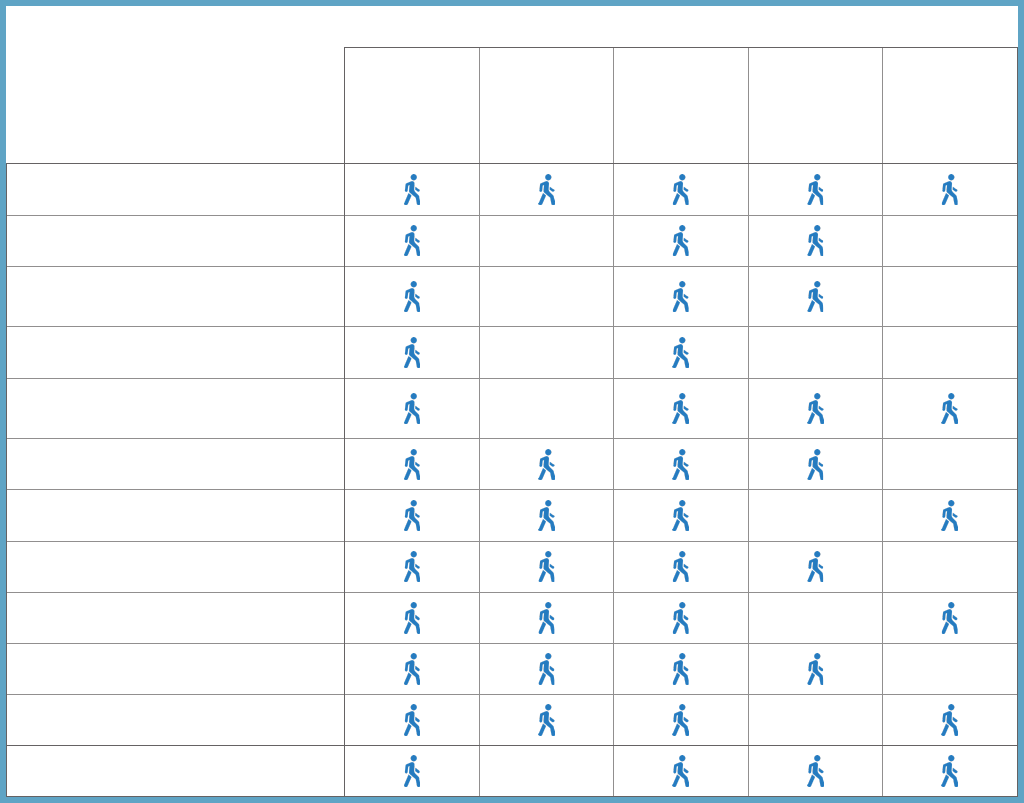
Table 2 shows the specific safety issues that
each countermeasure may address. For
example, the addition of PHBs has been
consistently shown to improve motorist
yielding by 90 percent or greater, when
compared with no traffic control or warning
type devices.
Table 2. Safety issues addressed per countermeasure.
Safety Issue Addressed
Pedestrian Crash Countermeasure
for Uncontrolled Crossings
Conflicts
at crossing
locations
Excessive
vehicle speed
Inadequate
conspicuity/
visibility
Drivers not
yielding to
pedestrians in
crosswalks
Insufficient
separation from
traffic
Crosswalk visibility enhancement
High-visibility crosswalk markings*
Parking restriction on crosswalk
approach*
Improved nighttime lighting*
Advance Yield Here To (Stop Here For)
Pedestrians sign and yield (stop) line*
In-Street Pedestrian Crossing sign*
Curb extension*
Raised crosswalk
Pedestrian refuge island
Pedestrian Hybrid Beacon
Road Diet
Rectangular Rapid-Flashing Beacon
*These countermeasures make up the STEP countermeasure “crosswalk visibility enhancements.” Multiple countermeasures may be
implemented at a location as part of crosswalk visibility enhancements.

18
Guide for Improving Pedestrian Safety at Uncontrolled Crossing Locations
Select Countermeasure(s)
Using Table 1 and Table 2 to Select Countermeasures
Table 1 provides initial countermeasure
options for various roadway conditions.
Each matrix cell indicates possibilities
that may be appropriate for
designated pedestrian crossings.
Not all of the countermeasures listed
in the matrix cell should necessarily
be installed at a crossing. Agency
officials should also review safety issues
referenced in Table 2, the surrounding
land development context, pedestrian
travel patterns, countermeasure
effectiveness, and costs when
considering what countermeasure(s)
are best suited for the crossing.
A marked crosswalk is useful to show
pedestrians and drivers preferred
crossing locations. However, for multi-
lane roadway crossings where vehicle
AADTs are in excess of 10,000, a marked
crosswalk alone is typically not sufficient
(Zegeer, 2005). Under such conditions,
more substantial crossing improvements
are also needed to prevent an increase
in pedestrian crash potential. Examples
of more substantial treatments include
the refuge island, PHB, and RRFB. Refer
to the symbols used in Table 1 for
when a marked crosswalk should be
paired with one or more of the other
countermeasures described.
To further increase visibility of
pedestrian crossings, agencies often
integrate multiple countermeasures.
For example, the Pedestrian Hybrid
Beacon is often installed in conjunction
with advance stop markings and
signs. Also, Road Diets present
opportunities for adding pedestrian
refuge islands and curb extensions
at key crossing locations. Agencies
should consider roadway geometry and
the MUTCD when integrating multiple
countermeasures.
Countermeasure Descriptions
This subsection describes considerations
for implementation of each of the
countermeasures included in Tables
1 and 2. The agency can review other
guidance—such as the MUTCD, the AASHTO
Pedestrian Guide, and/or agency policies
and practices—to identify and select
countermeasures for implementation.
Crosswalk visibility enhancements
High-visibility crosswalks may include a
variety of crosswalk striping designs, such
as ladder, continental, or bar pairs. A
high-visibility crosswalk is much easier for
an approaching motorist to see than the
traditional parallel lines. The agency should
strongly consider providing high-visibility
crosswalks at all established midblock
pedestrian crossings. The high-visibility
markings may be supplemented with the
pedestrian crossing warning signs (sign
W11-2 in the MUTCD) on each approach
to the crosswalk. MUTCD Section 2C.50—
Non Vehicular Warning Signs
and Section
3B.18—
Crosswalk Markings
provide
additional information.
The agency should also strongly consider
implementing parking restrictions on the
crosswalk approach at all established
19
Guide for Improving Pedestrian Safety at Uncontrolled Crossing Locations
Select Countermeasure(s)
pedestrian crossings (both approaches) so
there is adequate sight distance for motorists
on the approaches to the crossings and
ample sight distance for pedestrians
attempting to cross. The minimum setback
is 20 feet where speeds are 25 mph or less,
and 30 feet between 26 mph and 35 mph.
If this cannot be done, the curbs should
be “bulbed out” to allow the pedestrian
to see past the parked vehicle along the
street. Adjacent bus stops should be placed
downstream of the crosswalk and not on the
crosswalk approach.
The agency should consider providing
an appropriate level of lighting at
all established pedestrian crossings.
Consideration should be given to placing
the lights 10 to 15 feet in advance of the
crosswalk on both sides of the street and on
both approaches to better light the front of
the pedestrian and avoid silhouette lighting
(where possible).
In-street Pedestrian Crossing sign
In-street signs are placed in the middle of
the road at a crossing and are often used
in conjunction with refuge islands. These
signs may be appropriate on 2-lane or
3-lane roads with speed limits of 30 mph or
less. On higher-speed, higher-volume, and/
or multilane roads, this treatment may not
be as visually prominent; therefore, it may
be less effective (drivers may not notice
the signs in time to stop in advance of
the crosswalk). For such roadways, more
robust treatments will be needed. When
making the choice to use these signs, the
agency should consider making a plan
and securing a funding source for the
maintenance and prompt replacement of
damaged signs. The MUTCD permits in-
street pedestrian signs for installation on
centerlines and along lane lines. MUTCD
Section 2B.12—
In-Street and Overhead
Pedestrian Crossing Signs
contains additional
information about these signs.
Advance Yield Here To (Stop Here For)
Pedestrians sign and yield (stop) line
Advance Yield Here To (Stop Here For)
Pedestrians signs are placed between
30 and 50 feet in advance of the marked
crosswalk along with the stop line or “shark’s
teeth” yield line. This is a candidate treatment
for any uncontrolled pedestrian crossing,
and should be strongly considered for any
established pedestrian crossing on roads with
four or more lanes and/or roads with speed
limits of 35 mph or greater. Stop Here For
Pedestrians signs should only be used where
the law specifically requires that a driver must
stop for a pedestrian in a crosswalk. MUTCD
Section 2B.11—
Yield Here To Pedestrians Signs
and Stop Here For Pedestrians Signs
and
Section 3B.16—
Stop and Yield Lines
contain
additional information.
Curb extension
A curb extension or "bulbout" extends
the sidewalk or curb line into the street or
parking lane, thus reducing the street width
and improving sight distance between the
driver and pedestrian. A curb extension is a
candidate treatment for any uncontrolled
pedestrian crossing, particularly where
parking lanes exist. Curb extensions should
not extend into paths of travel for bicyclists.
Raised crosswalk
Raised crosswalks function as an extension
of the sidewalk and allow a pedestrian
to cross the street at a constant grade. A
raised crosswalk is typically a candidate
treatment on 2-lane or 3-lane roads with
speed limits of 30 mph or less and AADTs
below 9,000. Raised crossings are generally
20
Guide for Improving Pedestrian Safety at Uncontrolled Crossing Locations
Select Countermeasure(s)
avoided on truck routes, emergency routes,
and arterial streets. Drainage needs to
be accommodated. See MUTCD Section
3B.25—
Speed Hump Markings
for additional
information about markings that can be
used alongside raised crosswalks.
Pedestrian refuge island
A pedestrian island is typically constructed
in the middle of a 2-way street and
provides a place for pedestrians to stand
and wait for motorists to stop or yield. This
countermeasure is highly desirable for
midblock pedestrian crossings on roads
with four or more lanes, and should be
considered for undivided crossings of
four or more lanes with speed limits of 35
mph or greater and/or AADTs of 9,000
or greater. Median islands may also be
a candidate treatment for uncontrolled
pedestrian crossings on 3-lane or 2-lane
roads, especially where the street is wide
and/or where vehicle speed or volumes are
moderate to high. Consideration should be
given to creating a two-stage crossing with
the island to encourage pedestrians to cross
one direction of traffic at a time and look
towards oncoming traffic before completing
the second part of the crossing. The
minimum pedestrian refuge island width is
approximately 6 feet. MUTCD Section 3B.10—
Approach Markings for Obstructions
, Section
3B.18—
Crosswalk Markings
, and Section
3B.23—
Curb Markings
provide additional
information.
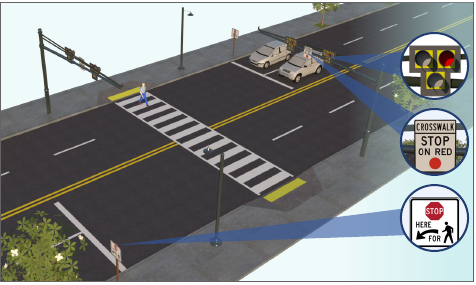
Pedestrian Hybrid Beacon (PHB)
A PHB head consists of two red lenses
above a single yellow lens, and is used in
conjunction with pedestrian signal heads
installed at each end of a marked crosswalk.
Figure 6 shows a rendering of a PHB. The PHB
has been referred to as the High-Intensity
Activated crossWalK beacon (HAWK), but the
MUTCD refers to this device as the PHB.
Unlike a traffic signal, the PHB rests in dark
until a pedestrian activates it via pushbutton
or other form of detection. When activated,
the beacon displays a sequence of flashing
and solid lights that control vehicular
traffic while the pedestrian signal heads
indicate the pedestrian walk interval and a
pedestrian clearance interval.
The PHB should meet the installation
guidelines—based on speed, pedestrian
volume, vehicular volume, and crossing
length—as provided in Section 4F.01 of the
MUTCD (See Figure 4F-1 for speeds of 35 mph
or less; Figure 4F-2 for speeds greater than 35
mph). Research indicates that PHBs are most
effective at roads with three or more lanes
that have AADTs above 9,000. PHBs should
be strongly considered for all midblock
crossings where the roadway speed limits
are equal to or greater than 40 mph. Refer
to Table 1 for other conditions where PHBs
should be strongly considered. It should be
noted that the PHB and RRFB are not both
installed at the same crossing location.
PHBs have also been installed successfully
at intersections under certain conditions.
Since the current MUTCD guidance is to
locate PHBs at least 100 feet away from
an intersection, engineering judgment/
engineering study must be carefully applied if
considering an installation at an intersection.
Figure 6. Rendering of a PHB.
Source: FHWA STEP Countermeasure Tech Sheets.
(Note: Drawing not to scale.)

21
Guide for Improving Pedestrian Safety at Uncontrolled Crossing Locations
Select Countermeasure(s)
Road Diet
A road diet reconfigures the roadway. A
frequently-implemented Road Diet involves
converting a 4-lane, undivided roadway into
a 3-lane roadway with a center turn lane. This
is a candidate treatment for any undivided
road with wide travel lanes or multiple lanes
that can be narrowed or repurposed to
improve pedestrian crossing safety.
After conducting a traffic analysis to
consider its feasibility, the agency may
determine that a Road Diet is a good
candidate for use on roads with four
or more lanes and traffic volumes of
approximately 20,000 or less. In some cases,
agencies have successfully implemented
Road Diets on roads with AADTs of up
to 25,000. By reducing the width of the
roadway, pedestrians benefit from shorter
crossing distances and often bike lanes or
streetscape features can be added. Road
Diets are often effectively accomplished
during pavement resurfacing.
Rectangular Rapid-Flashing Beacon
(RRFB)
An RRFB is a pedestrian-actuated conspicuity
enhancement used in combination with a
pedestrian, school, or trail crossing warning
sign to improve safety at uncontrolled,
marked crosswalks. The device includes two
rectangular-shaped yellow indications, each
with an LED-array-based light source, that
flash with high frequency when activated.
RRFBs may be used to enhance the
conspicuity of standard pedestrian
and school crossing warning signs at
uncontrolled marked crosswalks. RRFBs
are placed on both ends of a crosswalk.
If the crosswalk contains a pedestrian
refuge island or other type of median, an
RRFB should be placed to the right of the
crosswalk and on the median (instead
of the left side of the crosswalk). The
RRFB's irregular flashing pattern pattern
is unlit when not activated and can be
activated manually by pedestrians using
a push button or passively by a pedestrian
detection system. This device is not currently
included in the MUTCD, but FHWA has
issued Interim Approval 21 (IA-21) for the use
of the RRFB. State and local agencies must
request and receive permission to use this
interim approval before they can use the
RRFB. IA-21 provides additional information
about the conditions of use, including
dimensions, placement, and flashing
requirements. IA-21 does not provide
guidance or criteria based on number of
lanes, speed, or traffic volumes.
The RRFB is a treatment option at many
types of established pedestrian crossings.
Research indicates RRFBs can result in
motorist yielding rates as high as 98 percent
at marked crosswalks. However, yielding
rates as low as 19 percent have also been
noted. Compliance rates varied most per
the city location, posted speed limit, crossing
distance, and whether the road was one-
or two-way.
1
RRFBs are particularly effective
at multilane crossings with speed limits less
than 40 mph. Consider the PHB instead
of RRFBs for roadways with higher speeds.
Table 1 provides specific conditions where
practitioner s should strongly c onsid er the PH B
instead of the RRFB.
1
Fitzpatrick, K., M. Brewer, R. Avelar, and T. Lindheimer.
Will You Stop for Me? Roadway Design and Traffic Control Device Influences on Drivers Yielding to
Pedestrians in a Crosswalk with a Rectangular Rapid-Flashing Beacon.
Report No. TTI-CTS-0010. Texas A&M Transportation Institute, College Station, Texas. June
2016. https://static.tti.tamu.edu/tti.tamu.edu/documents/TTI-CTS-0010.pdf

22
Guide for Improving Pedestrian Safety at Uncontrolled Crossing Locations
Select Countermeasure(s)
RESOURCES
PEDSAFE, Pedestrian Safety Guide and
Countermeasure Selection System
This online tool includes links to research studies,
crash reduction statistics, and case studies for
nearly 70 pedestrian safety countermeasures.
Its Countermeasure Selection Tool provides
countermeasure recommendations for uncontrolled
crossing locations based upon variables such as
AADT, vehicle speed, and number of lanes.
Manual on Uniform Traffic Control Devices (MUTCD)
This manual provides transportation engineers and
planners with detailed guidance for the design
and application of traffic control devices, including
signage, roadway markings, and intersection controls.
Refer to the specific sections of the MUTCD listed in
the countermeasure descriptions and consult State-
level supplements for additional information.
FHWA Road Diet Desk Reference (2015)
This resource includes sample policy, case studies,
and design guidance for agencies and decision-
makers considering Road Diets. The benefits of Road
Diets include reducing vehicle speeds, reducing
number of lanes to cross, and allocating space for
pedestrian refuge islands.
Highway Safety Manual
This manual provides detailed guidance for the
collection, analysis, and evaluation of roadway
crash data, as well as related CMFs and treatment
selection guidance.
FHWA Design Resource Index
This resource directs practitioners to the specific
location of information about pedestrian and bicycle
treatments or countermeasures, across various
design guidelines published by organizations such as
AASHTO, the Institute of Transportation Engineers, and
National Association of City Transportation Officials.
Informational Brief: Treatments for Uncontrolled
Marked Crosswalks (2017)
FHWA provided this information about optional
treatments for uncontrolled pedestrian crossing
locations.
TCRP REPORT 112/NCHRP REPORT 562: Improving
Pedestrian Safety at Unsignalized Crossings (2006)
This document recommends treatments to improve
safety for pedestrians crossing high-volume, high-
speed roadways at unsignalized intersections,
with particular focus on roadways served by public
transportation.
NHTSA "A Primer for Highway Safety Professionals"
(2016)
This resource outlines a comprehensive approach
to improving safety for bicyclists and pedestrians
and offers a summary of the most frequently used
engineering, enforcement, and education safety
measures. The resource identifies how certain
treatments may be placed in relation to other
treatments, such as the coordinated installation of a
pedestrian refuge island and lighting.
CMF Clearinghouse
The CMF Clearinghouse is an online database of
countermeasures and corresponding CMFs. The
database describes the confidence of the study that
produced the CMF with an assigned “star quality
rating.” The clearinghouse includes CMFs for most
of the STEP countermeasures.
NCHRP Report 841: Development of CMFs for
Uncontrolled Pedestrian Crossing Treatments
(2017)
This report describes the safety benefits and CMFs
for four types of pedestrian crossing treatments—
rectangular rapid flashing beacons, PHBs,
pedestrian refuge islands, and advance crosswalk
signs and pavement markings.
NCHRP Synthesis 498: Application of Pedestrian
Crossing Treatments for Streets and Highways (2016)
This is a compilation of existing practices regarding
the selection and implementation of pedestrian
crossing improvements, as well as a literature
review of research on more than 25 pedestrian
crossing treatments.
Consult Design and Installation Resources
23
Guide for Improving Pedestrian Safety at Uncontrolled Crossing Locations
GUIDING PRINCIPLES
This section identifies additional resources that refine countermeasure options for priority sites. The following are
important considerations for this step:
» Consult the MUTCD for recommendations for signage and roadway markings for all countermeasures.
» Review the MUTCD (Part 4) for more considerations, including pedestrian volumes and vehicle operating speeds,
for the installation of PHBs.
» Consult local and national design guidance for the preferred width and placement of these countermeasures.
Review Agency Design Guidelines
The agency can review and, if needed,
enhance local guidance for traffic engineers
and roadway designers to follow when
installing countermeasures. The agency’s
roadway design manual can include details,
such as design and installation guidance,
for each of the countermeasure options.
The agency may also consider creating
additional warrant and threshold guidance
for countermeasures such as the Road Diet,
considering local conditions.
Consult the MUTCD
The agency may focus on three parts of the
MUTCD for additional considerations when
installing countermeasures:
» Part 2: Signs.
» Part 3: Markings.
» Part 4: Highway Traffic Signals (includes
detailed guidance for installing Pedestrian
Hybrid Beacons based on traffic speeds,
traffic volumes, and pedestrian volumes).
RESOURCE
AASHTO Guide for the Planning, Design, and Operation of Pedestrian Facilities, 1st Edition (2004)
This guide provides recommendations for the planning, design, and operation of accommodations for
pedestrians on public rights-of-way. This guide also discusses the impact of land use and site design on
pedestrian safety and connectivity.
5
Consult Design and
Installation Resources
Identify Opportunities and Monitor Outcomes
24
Guide for Improving Pedestrian Safety at Uncontrolled Crossing Locations
GUIDING PRINCIPLES
This section describes possible options for funding and implementation of the countermeasures described in this
guide. The following are important considerations for this step:
» Review the State's HSIP process for considering and funding pedestrian crossing countermeasures.
» Review local traffic calming and land development policies for opportunities to install pedestrian crossing
countermeasures.
» Consider the costs to design, install, and maintain selected countermeasures.
» Collect usage and crash data for at least three years after countermeasures are installed at priority sites.
» Continue to monitor priority sites not funded for countermeasure installation.
» Provide information to the public about planned countermeasure projects. Information should address the safety
benefits and possible impacts to traffic operations.
Consider Funding Options
A major consideration when selecting a safety
project or program is identifying and securing
the funding to design, construct, operate,
and maintain the project or program. FHWA,
NHTSA, and other Federal agencies distribute
funding to States and other jurisdictions
for transportation safety projects. If local
funding is scarce, agencies may approach
the State Departments of Transportation for
safety improvement funding consideration.
Some projects may require a local match to
leverage State or Federal dollars. The agency
may consider the following steps:
» Submit high-priority pedestrian crash
locations as HSIP projects.
» Consider other State safety funding
programs for low-cost pedestrian safety
improvements.
» Address gaps in pedestrian
accommodations through other State
or Federal funding programs such as
Transportation Alternatives Program,
Congestion Mitigation and Air Quality, and
Surface Transportation Block Grant (STBG).
6
Identify Opportunities and
Monitor Outcomes
25
Guide for Improving Pedestrian Safety at Uncontrolled Crossing Locations
Identify Opportunities and Monitor Outcomes
Identify Opportunities for
Successful Implementation
The agency can look beyond safety-focused
funding programs to help implement
countermeasures. By incorporating safety
treatments into roadway maintenance
or traffic operation projects, the agency
can realize cost savings. For example, the
agency should consider how resurfacing
and operational projects may include
countermeasures such as Road Diets and
pedestrian crossing signal improvements.
The agency can also engage the
community prior to programing the project.
The treatments are likely to affect traffic
operations, and the public may respond
negatively to the change without sufficient
notice and education. The agency can
develop public education materials
describing the benefits and costs of the
countermeasures. Law enforcement,
pedestrian safety advocates, public health
officials, and other community partners may
be able to help distribute the materials.
It is important for the agency to work
with local partners to coordinate early
in the process of designing or improving
a roadway to identify opportunities for
improved pedestrian crossing safety. If the
agency has a Complete Streets policy in
place, the policy describes how pedestrian
crossing treatments and sidewalks are
incorporated into roadway projects.
Roadway project design should identify
locations and countermeasure options for
pedestrian crossings. Developing preliminary
cost estimates early for these improvements
will help local partners make decisions about
funding for pedestrian crossing treatments.
The agency can also work with land
developers to incorporate pedestrian
crossing treatments into site plans and
connecting roadways. Land development
policies provide an opportunity to integrate
pedestrian and multimodal improvements,
connectivity, and accommodations
into site plans and nearby roadways.
The agency can examine development
policies or ordinances for requirements to
install sidewalks and pedestrian crossing
treatments.
Construct Improvements
The public may have questions about the
improvements as construction activities
begin. The agency should post information
about the improvements and a timeline for
construction to a public-facing website and
consider issuing a press release about the
project. The agency should also provide
detailed information to neighbors and
business owners impacted by construction
activities about the project. Pedestrians will
maintain access through the work zone area
by way of temporary walkways, curb ramps,
and traffic control signage.
The agency may consider phasing in the
improvements. For example, a refuge
island can be implemented initially by
pavement markings and flexible delineators
in the center lane. The agency can later
add a raised median and appropriate
landscaping at the refuge island.
Monitor Results of Implementation
The agency should consider monitoring
the impacts of countermeasures per
defined performance measures. Specific
performance measures can be outlined
in plans, such as a PSAP. The PSAP may

26
Guide for Improving Pedestrian Safety at Uncontrolled Crossing Locations
Identify Opportunities and Monitor Outcomes
also list priority locations and proposed
countermeasures.
The first measure of success for a project or
program is public support. States and local
governments can prepare public information
for countermeasures that are new to the
community or may change traffic patterns.
Public information about the projects may
describe the crash history or risks noted
at the site, as well as the benefits of the
proposed countermeasure.
States and local government can also
collect and analyze crash and traffic data
related to countermeasure sites for at least 3
years following the installation of the project.
This time allows for data to be collected to
compare crash rates and severity with the
same data collected before the installation.
The agency should work with their State HSIP
to evaluate projects by continuing to collect
data, and it is essential that the treatment
installation date be documented. In addition
to the safety performance of the treatment,
agency staff should consider assessing the
durability and life cycle maintenance needs
for in-service devices.
In addition to crash data, it is important
to collect data on pedestrian volumes,
traffic speeds, and interactions between
pedestrians and drivers. Pedestrian volume
data can help demonstrate the benefits
of implementing safety countermeasures.
Information about traffic speeds and
behaviors also help confirm the effectiveness
of installing these countermeasures. As
more pedestrian crossing treatments are
implemented, State and local agencies can
use these data to research the effectiveness
of countermeasures and best practices for
installation. Evaluation also helps an agency
demonstrate the value of the investment in
countermeasures to community leaders and
the public.
RESOURCES
FHWA Federal-aid Program Administration
This website includes links to guidance for local and
State governments administering federally-funded
projects, such as those funded by HSIP or STBG.
FHWA Guidebook for Developing Pedestrian and
Bicycle Performance Measures (2016)
This resource identifies a wide variety of potential
metrics for setting goals, prioritizing projects and
evaluating outcomes of bicycle and pedestrian plans,
including plans for pedestrian safety improvements.
Performance measures may include pedestrian
levels of service or pedestrian fatality rates.
FHWA Pedestrian and Bicycle Funding
Opportunities Summary (2016)
This resource includes a matrix comparing eligibility
of various federal transportation funding programs
for different types of bicycle and pedestrian projects.
NCHRP Report 803: Pedestrian and Bicycle
Transportation Along Existing Roads—ActiveTrans
Priority Tool Guidebook (2015)
This resource includes an interactive tool and
guidance to help agencies prioritize pedestrian
and bicycle improvements, including safety
projects, either as standalone or incidental to a
roadway project.
27
Guide for Improving Pedestrian Safety at Uncontrolled Crossing Locations
Glossary
Glossary
Annual Average Daily Traffic (AADT)
The total volume of traffic passing a point
or segment of a highway facility in both
directions for one year divided by the
number of days in the year.
Average Daily Traffic (ADT)
The average 24-hour volume of traffic
passing a point or segment of a highway in
both directions.
Complete Streets
Complete Streets are designed and
operated to enable safe access for all users,
including pedestrians, bicyclists, motorists,
and transit riders of all ages and abilities.
(Smart Growth America, National Complete
Streets Coalition.)
Controlled pedestrian crossing
A pedestrian crossing where motorists are
required to stop by either a STOP sign, traffic
signal, or other traffic control device.
Crash modification factor (CMF)
A multiplicative factor used to compute
the expected number of crashes after
implementing a given countermeasure. If
available, calibrated or locally developed
State estimates may provide a better
estimate of effects for the State. (Crash
Modification Factors Clearinghouse.)
Crash reduction factor (CRF)
The percentage crash reduction that might
be expected after implementing a given
countermeasure at a specific site.
Curb extensions
A roadway edge treatment where a curb
line is bulbed out toward the middle of the
roadway to narrow the width of the street.
Curb extensions are sometimes called
“neckdowns.”
Highway Safety Improvement Program
(HSIP)
A Federal-aid program with the purpose
to achieve a significant reduction in traffic
fatalities and serious injuries on all public
roads, including non-State-owned roads
and roads on tribal land. The HSIP requires
a data-driven, strategic approach to
improving highway safety on all public roads
with a focus on performance. (FHWA.)
High visibility crosswalk
A pedestrian crossing location marked
by patterns such as zebra, ladder, or
continental markings as described by the
MUTCD.
Marked crosswalk
A pedestrian crossing that is delineated by
white crosswalk pavement markings.
Parking restriction
Parking restriction can include the removal of
parking space markings, installation of new
“parking prohibition” pavement markings or
curb paint, and signs.
28
Guide for Improving Pedestrian Safety at Uncontrolled Crossing Locations
Glossary
Pedestrian Hybrid Beacon (PHB)
A traffic control device with a face that
consists of two red lenses above a single
yellow lens. Unlike a traffic signal, the PHB
rests in dark until a pedestrian activates it via
pushbutton or other form of detection.
Raised crosswalk
Raised crosswalks are ramped speed tables
spanning the entire width of the roadway,
often placed at midblock crossing locations.
Rectangular Rapid-Flashing Beacon
(RRFB)
RRFBs are pedestrian-actuated conspicuity
enhancements used in combination with a
pedestrian, school, or trail crossing warning
sign to improve safety at uncontrolled,
marked crosswalks. The device includes
two rectangular-shaped yellow indications,
each with an LED-array-based light source,
that flash with high frequency when
activated. RRFBs are placed on both ends
of a crosswalk. If the crosswalk contains a
pedestrian refuge island or other type of
median, an RRFB should be placed to the
right of the crosswalk and on the median
(instead of the left side of the crosswalk).
The flashing pattern is pedestrian-activated
by pushbuttons or automated detection
and is unlit when not activated.
Refuge island
A median with a refuge area that is
intended to help protect pedestrians who
are crossing the road. This countermeasure
is sometimes referred to as a crossing island
or pedestrian island.
Road Diet
A roadway reconfiguration resulting in a
reduction in the number of travel lanes.
The space gained by eliminating lanes
is typically used for other uses and travel
modes. (FHWA.)
Road Safety Audit (RSA)
A formal examination of an existing or future
road or intersection by a multidisciplinary
team. It qualitatively estimates and reports
on potential road safety issues and identifies
opportunities for improvements in safety for
all road users. (FHWA.)
Toward Zero Deaths (TZD)
TZD is a traffic safety framework that seeks
to eliminate highway fatalities by engaging
diverse safety partners and technology to
address traffic safety culture. (See also:
Vision Zero.)
Uncontrolled pedestrian crossing
An established pedestrian crossing that
does not include a traffic signal, beacon, or
STOP sign to require that motor vehicles stop
before entering the crosswalk.
Vehicle queue
A line of stopped vehicles in a single travel
lane, commonly caused by traffic control at
an intersection.
Vision Zero (VZ)
Similar to TZD, Vision Zero is a vision to
eliminate traffic fatalities and serious injuries
within the transportation system. VZ employs
comprehensive strategies to address
roadway design, traffic behavior, and law
enforcement.
29
Guide for Improving Pedestrian Safety at Uncontrolled Crossing Locations
Appendix A: Framework for a Resolution Supporting Pedestrian Safety
Appendix A: Framework for a Resolution
Supporting Pedestrian Safety
Agency policies respond to a need or opportunity, such as pedestrian safety crash and
fatality trends. A resolution may help decision-makers, including elected officials or appointed
commissioners, better understand the need for pedestrian crash countermeasure policy or
design guidance.
The following is a list of possible elements for a local or Statewide resolution in support of a
pedestrian crossing policy. These elements may be developed into “Whereas” statements
or be included as explanatory text introducing the policy. The list of resolution elements is
presented as four categories covering a spectrum of pedestrian safety issues.

30
Guide for Improving Pedestrian Safety at Uncontrolled Crossing Locations
Appendix A: Framework for a Resolution Supporting Pedestrian Safety
1. Example statistics that may
raise awareness of pedestrian
safety trends.
SAMPLE LANGUAGE
“Whereas the number of pedestrian
crashes per year and the percent of
pedestrian fatalities out of all traffic
fatalities in [
State
] demonstrate the
need for improved pedestrian safety at
roadway crossings…”
» Percent pedestrian fatalities of total traffic
fatalities.
» Number of total pedestrian crashes/
fatalities per year.
» Percent of pedestrian crashes occurring
outside the intersection.
2. List of broad issues that
agencies commonly consider
when discussing pedestrian safety
and crash countermeasures.
SAMPLE LANGUAGE
“Whereas [
Agency/State
] recognizes
that safety is a priority for all road users,
and improvements to pedestrian safety
often improve safety for all road users…”
» Safety is a priority for all road users.
» Crossings are essential to a complete
network for pedestrian mobility.
» Pedestrian safety is part of overall quality
of life and improved public health.
» Improvements to pedestrian safety often
improve safety for all road users.
» Pedestrian countermeasures are genreally
lower-cost treatments.
» Many pedestrian crash countermeasures
have been evaluated as highly effective.

31
Guide for Improving Pedestrian Safety at Uncontrolled Crossing Locations
Appendix A: Framework for a Resolution Supporting Pedestrian Safety
3. List of example planning
documents that frequently
discuss Statewide pedestrian
safety concerns and may include
statistics or other compelling
reasons for implementing
pedestrian crossing treatments.
SAMPLE LANGUAGE
“Whereas [
State
]'s Strategic Highway
Safety Plan addresses pedestrian safety
as an emphasis area…”
» State Strategic Highway Safety Plan
includes pedestrian safety as an emphasis
area.
» State Highway Safety Plan includes
pedestrian safety programs or
enforcement support.
» State Roadway Design Manual includes
guidance for countermeasure design.
» Highway Safety Improvement Program
includes safety performance targets for
non-motorists.
4. List of Statewide opportunities
for promoting, planning, and
funding the construction of
pedestrian crossing treatments.
SAMPLE LANGUAGE
“Whereas [
Agency
]'s Highway Safety
Improvement Program includes
specific funding for pedestrian crash
countermeasures…”
» Highway Safety Improvement Program
includes specific focus or funding for
pedestrian crash countermeasures.
» Complete Streets Policy directs the
inclusion of pedestrian accommodations
as part of other transportation projects.
» Vision Zero or Towards Zero Deaths
initiative strives to reduce or eliminate
all traffic-related fatalities, including
pedestrians.

32
Guide for Improving Pedestrian Safety at Uncontrolled Crossing Locations
Appendix B: CRF and CMF Summary Table
Appendix B: CRF and CMF Summary Table
Table 3. CRFs and CMFs by countermeasure.
Countermeasure CRF CMF Basis Reference
Crosswalk visibility enhancement¹ — — — —
Advance STOP/YIELD signs and
markings
25% 0.75 Pedestrian crashes² Zegeer, et. al. 2017
Add overhead lighting 23% 0.77 Total injury crashes Harkey, et. al. 2008
High-visibility marking³ 48% 0.52 Pedestrian crashes Chen, et. al., 2012
High-visibility markings (school zone)³ 37% 0.63 Pedestrian crashes Feldman, et. al. 2010
Parking restriction on crosswalk
approach
30% 0.70 Pedestrian crashes Gan, et. al., 2005
In-street Pedestrian Crossing sign UNK UNK N/A N/A
Curb extension UNK UNK N/A N/A
Raised crosswalk (speed tables)
45% 0.55 Pedestrian crashes
Elvik, et. al., 2004
30% 0.70 Vehicle crashes
Pedestrian refuge island 32% 0.68 Pedestrian crashes Zegeer, et. al., 2017
PHB 55% 0.45 Pedestrian crashes Zegeer, et. al., 2017
Road Diet – Urban area 19% 0.81 Total crashes Pawlovich, et. al., 2006
Road Diet – Suburban area 47% 0.53 Total crashes Persaud, et. al., 2010
RRFB 47% 0.53 Pedestrian crashes Zegeer, et. al. 2017
¹This category of countermeasure includes treatments which may improve the visibility between the motorist and the crossing pedestrian.
²Refers to pedestrian street crossing crashes, and does not include pedestrians walking along the road crashes or “unusual” crash types.
³The effects of high-visibility pavement markings (e.g., ladder, continental crosswalk markings) in the “after” period is compared to pedestrian
crashes with parallel line markings in the “before” period.
References
1. Zegeer, C., R. Srinivasan, B. Lan, D. Carter, S. Smith,
C. Sundstrom, N.J. Thirsk, J. Zegeer, C. Lyon,
E. Ferguson, and R. Van Houten.
NCHRP Report
841: Development of Crash Modification Factors
for Uncontrolled Pedestrian Crossing Treatments.
NCHRP, Transportation Research Board, Washington,
DC, 2017.
2. Harkey, D.L., R. Srinivasan, J. Baek, F. Council, K.
Eccles, N. Lefler, F. Gross, B. Persaud, C. Lyon,
E. Hauer, and J. Bonneson.
NCHRP Report 617:
Accident Modification Factors for Traffic Engineering
and ITS Improvements
. NCHRP, Transportation
Research Board, Washington, DC, 2008.
33
Guide for Improving Pedestrian Safety at Uncontrolled Crossing Locations
Appendix B: CRF and CMF Summary Table
3. Chen, L., C. Chen, R. Ewing, C.E. McKnight, R.
Srinivasan, and M. Roe. “Safety Countermeasures
and Crash Reduction in New York City—Experience
and Lessons Learned."
Accident Analysis and
Prevention
, 2012.
4. Feldman, M., J. Manzi, and M. Mitman. "An
Empirical Bayesian Evaluation of the Safety Effects
of High-Visibility School (Yellow) Crosswalks in San
Francisco, California."
Transportation Research
Record: Journal of the Transportation Research
Board,
No. 2198, Transportation Research Board,
Washington, D.C., 2010, pp. 8-14.
5. Gan, A., J. Shen, and A. Rodriguez. "Update of Florida
Crash Reduction Factors and Countermeasures
to Improve the Development of District Safety
Improvement Projects." Final report. Florida
Department of Transportation, Tallahassee, FL, 2005.
6. Elvik, R., P. Christensen, and A. Amundsen. "Speed
and Road Accidents An Evaluation of the Power
Model." Transportokonomisk Institutt, Oslo, Norway,
2004.
7. Pawlovich, M.D., W. Li, A. Carriquiry, and T. Welch.
"Iowa's Experience with Road Diet Measures—Use
of Bayesian Approach to Assess Impacts on Crash
Frequencies and Crash Rates."
Transportation
Research Record: Journal of the Transportation
Research Board,
No. 1953, Transportation Research
Board, Washington, D.C., 2006.
8. Persaud, B., B. Lan, C. Lyon, and R. Bhim.
"Comparison of empirical Bayes and full Bayes
approaches for before–after road safety evaluations."
Accident Analysis & Prevention
, Volume 42, Issue 1,
2010, pp. 38-43.
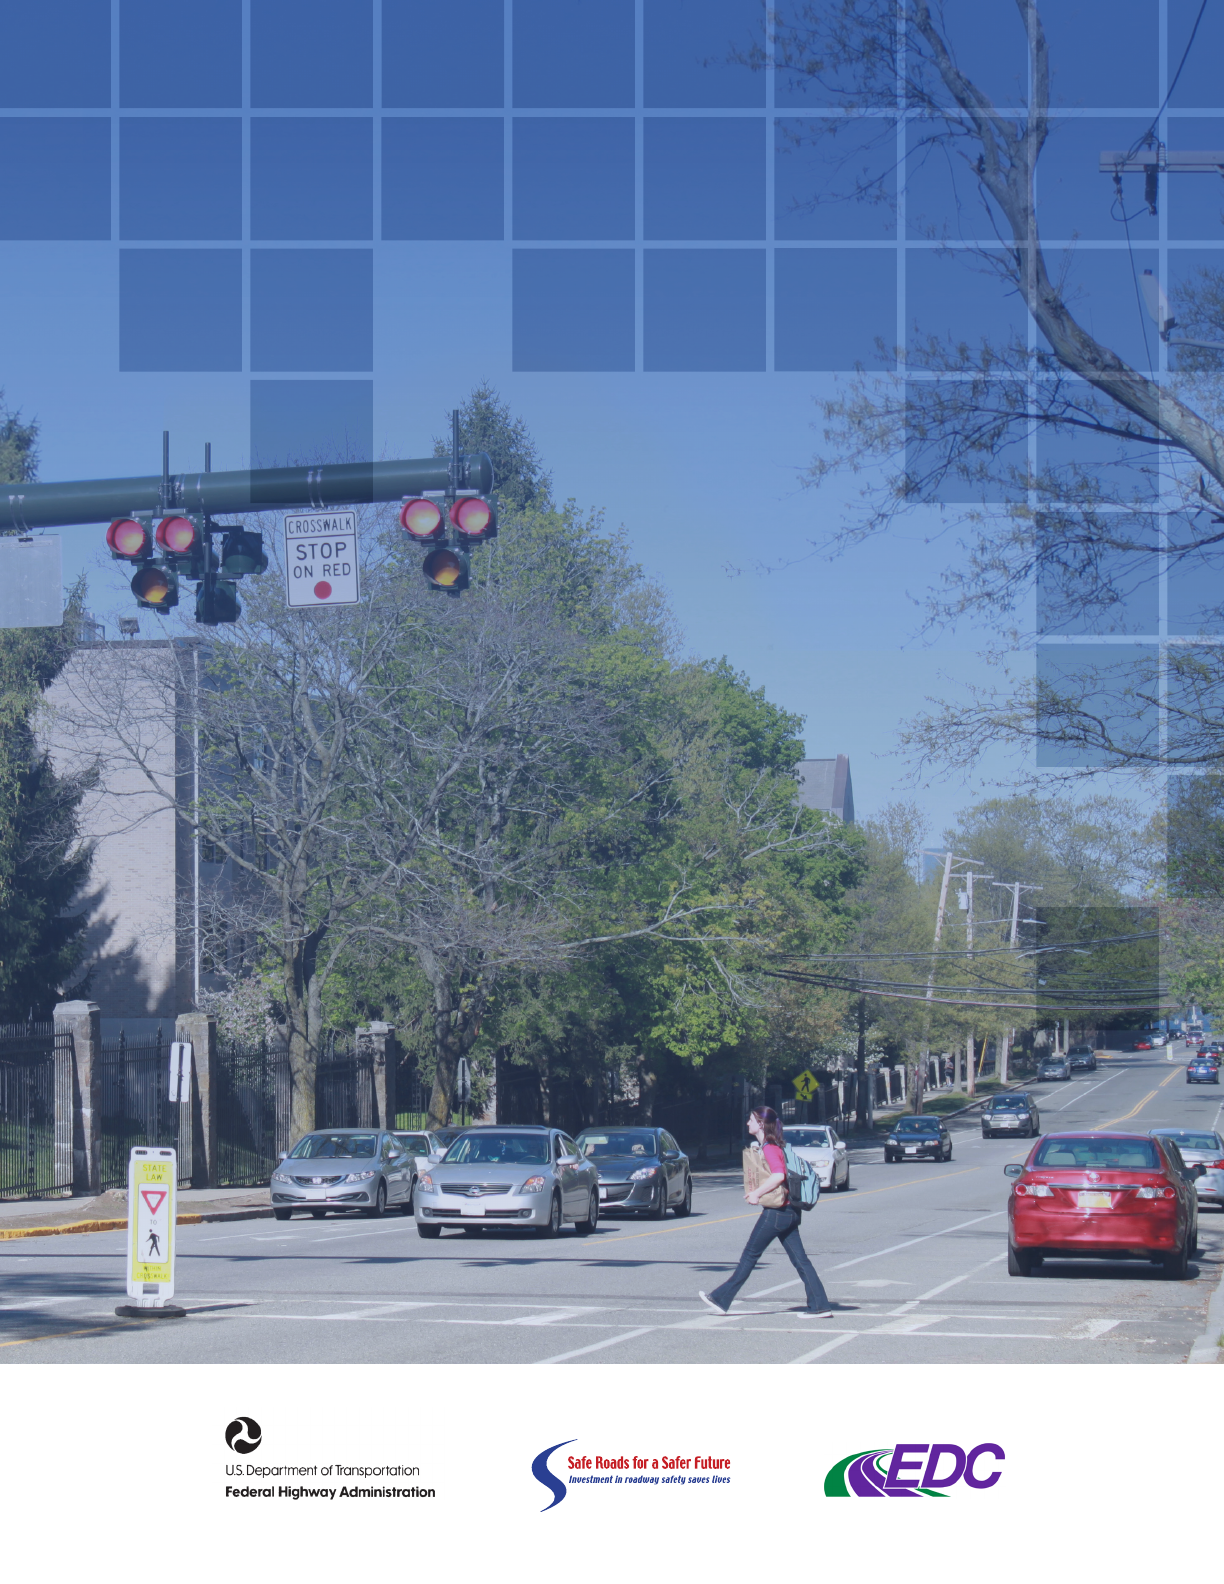
FHWA-SA-17-072
July 2018, Updated
